Retailers who operate facilities, both physical stores and online stores want to constantly optimize the shopping experience of their customers. Why? Because an easy and pleasant experience increases sales. Simple as that. So shopping experience need to be permanently changed for the better.
But does really every change lead to increased sales? How can this be proven?
And sometimes the customer behavior is also changing over time: How can you know that the current service still good enough?
In other words: Customer experience need to be tested and measured in a continuous process.
But which capabilities do I need for this?
- Be able to push changes fast to production
First of all, you need to be able to change your service fast in production. Of course, physical changes of the infrastructure like changes in a physical store need more planning. But let’s assume that nowadays most of the business changes will be delivered digitally anyways. And in order to do incremental changes and rollbacks very fast, a DevOps team and a technical platform that enables DevOps principles will be a necessity. - Divide and conquer
But the pure ability to drive business changes very fast will not suffice: You need to be able to segment your user base and deliver experimental changes to a well defined and representative user base. Another group of your user base need to receive the standard service and acts as the “control group”. This is the data to which you compare your experiment later on.
In order to do this, an external traffic control has to be in place that is able to dynamically select which version has to be used. - Measure it
The third capability will be the metrics you can capture from this. After defining a positive outcome (i.e. an actual order) you need to measure the behavior of both groups during an appropriate time frame and record the outcome. Metrics data need to be stored and finally exportable for further analysis. - Analyze it
After recording the outcome you need to interpret the results. And this is more difficult than one might think, just because the experimental group had more successful outcomes than the control group does not mean, that the change really caused the effect. A thorough statistical analysis with a proper hypothesis testing needs to be performed to be able to make a meaningful statement. In order to do that one needs to import the data sets, transform the data and be able to automatically perform complex mathematical transformations. And if you want to do that in a version controlled and reliable way you should use a proper platform for this instead of using Excel sheets.
Of course one could employ for each capability a specialized environment, but then the efforts to control this and to transfer the artifacts and data would be complicated and cumbersome. But can this all be done using a single platform and its ecosystem? Let’s give it a try:
The all-in-one platform
Well, Red Hat OpenShift is well known as a developer self-service DevOps platform that enables teams to develop, test and deploy applications fully automated into production and provide flexibility, security and scalability for nearly any workload.

And using the built-in deployment techniques like blue-green or canary deployments can be done out-of-the box. But to perform these controlled experiments with a defined user base we probably need a more sophisticated approach. Luckily, Red Hat OpenShift has a huge ecosystem of automatically managed add-ons that be of help here. One if it is Red Hat Service Mesh!
Meshing up!

Red Hat Service Mesh is adding sidecar proxy containers to each application pod that can take care of traffic control, generation of metrics, authentication and mutual encryption, without having to incorporate anything into the application itself. This helps to visualize the traffic and to change the routing based on a defined set of rules.
And these rules will be used to do a proper A/B testing of applications. Service Mesh collects all the metrics into the system. They are monitored via Grafana or extracted directly from Prometheus.
Ideally we could export the data into an S3 object store bucket that also runs via OpenShift Container Storage also on the platform. But any other storage will do also.
Open Data on a Hub
Last but not least, we need an environment to do a proper statistical analysis on the data and hypothesis testing. A perfect tool for this are Jupyter notebooks that can be spun up on demand and have access to all the data on the platform. Now the https://opendatahub.io project is coming to help! It provides an operator that can directly be installed from the operator hub, which provides all the tools that are needed to do data analysis and even machine learning on OpenShift!

For the last step you then just need to access the data in an Opendatahub Jupyter notebook and perform your calculations. The notebooks can be saved using a git repo in a version controlled manner. In the end you will be able to proof if the change you wanted to test will really bring business value to you. And everything but just using one platform: Red Hat OpenShift!
A practical example
Let’s assume, your are running an online bookstore and experiment with the change of the appearance of the reviews. Your page may either look like this:

Or, slightly modified (look at the nice color of the stars):

Will this change impress the readers?Are they following the ratings more likely, when the appearance is more prominent? Let’s test it!
OpenShift and Service Mesh as the foundation
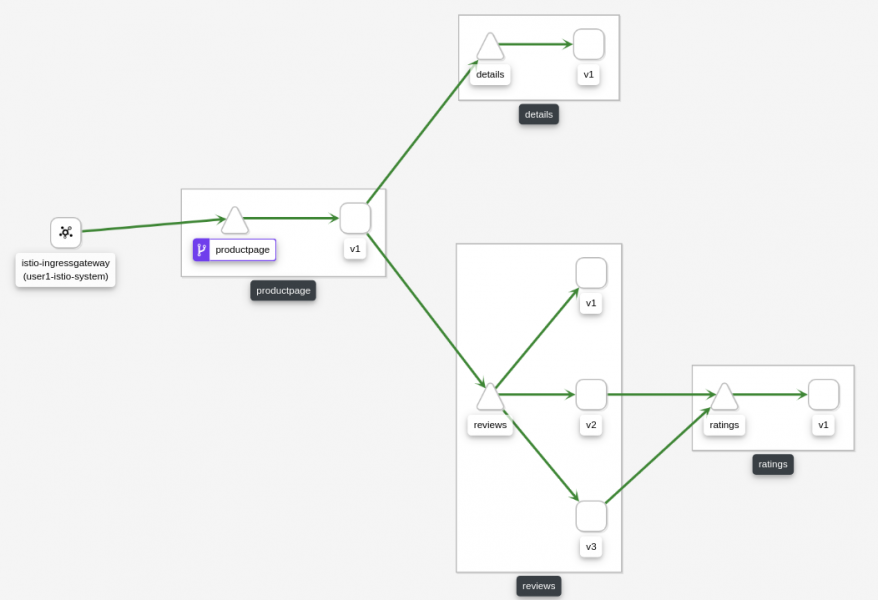
Using Red Hat OpenShift and Red Hat Service Mesh we have deployed the application in microservices. But the review service is deployed three times in parallel:
- showing no ratings at all (v1)
- showing black rating stars (v2)
- showing red rating stars (v3)
With Red Hat Service Mesh we now can distribute the traffic onto the different versions on different criteria:
- a free to choose percentage of the incoming traffic
- distinguish between authenticated and unauthenticated users
- different sets of defined user groups or lists
Service Mesh then visualizes the traffic flow:

The live analysis of the results are displayed in a grafana dashboard:

The experiment is now ready to run: The application is deployed, the review service already in different versions and data capture is on! This now has to run until enough data points are collected for later statistical analysis.
Analysis in the hub
To analyze the data, you will need a proper tooling for data importing, extracting, formatting, and to perform calculations on it. Data scientists work and share their data very often in Jupyter notebooks, where they can experiment, document and calculate. Luckily Jupiterhub is automatically spawned on OpenShift from the Opendatahub operator. You can start right away and explore the data:

Exploring the data helps to understand the data and to recognize outliers or unexpected events. When you understand the data properly and you have transformed and normalized the data , you are ready for a statistical analysis. You can do this directly in a Jupyter notebook, too:

Congratulations! You (possibly) proved that red stars lead to more book sales. Now you can start the next experiment right away. Without the need of a bunch of new and complex tools!
Summary
We have seen in this example how one single multi-purpose development and compute platform can enable a cross functional team of business analysts, developers and data scientists do its daily work of enhancing the customer experience! The business value of the platform is much more than just development speed or high availability and scalability. Of course, this is included anyway, but the greatest value is in the way the platform is used to generate more revenue for the business.