
Introduction
According to the 2023 DevOps Automation Pulse Report[1] 71% of organizations use observability data and insights to drive automation decisions and improvements in DevOps workflows.
However, 85% of organizations face challenges using observability and security data to drive DevOps automation.
The top three challenges facing organizations include
- inaccessible data (51%)
- siloed data (43%)
- and the need for data to flow through many systems to be analysed (41%).
One of Red Hat’s partners helping us to support our customers with their observability journey is Dynatrace. Dynatrace delivers the data and insights, Red Hat the power to automate and remediate.
In this blog we want to elaborate on how Red Hat and Dynatrace enables customers to increase automation rate by combining deep insights into complex hybrid environments with DAVIS AI and smart configuration and remediation possibilities with Event Driven Ansible
But before we dig into the details, let’s take a step back and have a look at what already happened:
Retrospection
The previous blog, OpenShift App Observability with Dynatrace[2], covered using the Dynatrace Operator to observe log, metrics and events from your Red Hat OpenShift container platform and its running application shown on a concrete java application example.
But now in this blog we will take the next logical step and have a look together on how to remediate problems discovered by such a monitoring approach.
Summary
We will start with elaborating on the partnership as such and what is the main purpose of this blog.
Then we come to the more technical part where we start with a concrete use case example. This one is picked up in an implementation chapter.
But there is material of all the different implementation options, too.
The use case is again picked up in a high-level architecture. We will also show how the workflow setup in Dynatrace would work. We will close the technical part with a flow diagram around automated remediation with the use of Event-Driven Ansible.
At the end of the blog you will find the key takeaways.
So, we hope you enjoy the ride and let’s get started with the first point, why Dynatrace and Red Hat came together for a strategic partnership.
Why Partnership
One of the main reasons for failing container adoption journeys is the loss of control. In decoupling functionality by breaking down monoliths into smaller chunks the whole application landscape gets more and more decentralized. With this, the challenge to have easy monitoring with full coverage gets increasingly difficult.
This is why it is crucial to have a sustainable concept before starting such a journey.
Success can be possible on your own, but more often collaboration and partnerships are the key to success in organizations. As the saying goes “Two heads are better than one,” and that’s never been more true than today. The fast pace of technology calls for collaboration and partnership.
In this partnership two platform and market leaders come together:
- Red Hat with it’s container platform OpenShift and IT automation solution Ansible Automation Platform including Event-Driven Ansible
- Dynatrace as Observability and Security Analytics and Automation platform
Both companies on their own enable compelling use cases – yet combined it can usher in a new era of cloud-native intelligent IT operations. In other words: this strategic partnership between Dynatrace and Red Hat makes sense in so many ways and is just a great match.
What is the main mission
We want to:
- discover issues before they occur and have a quicker root cause detection
- react on exception right away in an automated fashion maybe even with the use of AI capabilities
- and with that reduce operational costs and enable faster delivery and MTRS time
To make these three points easier to comprehend, let’s break them down into one concrete use case.
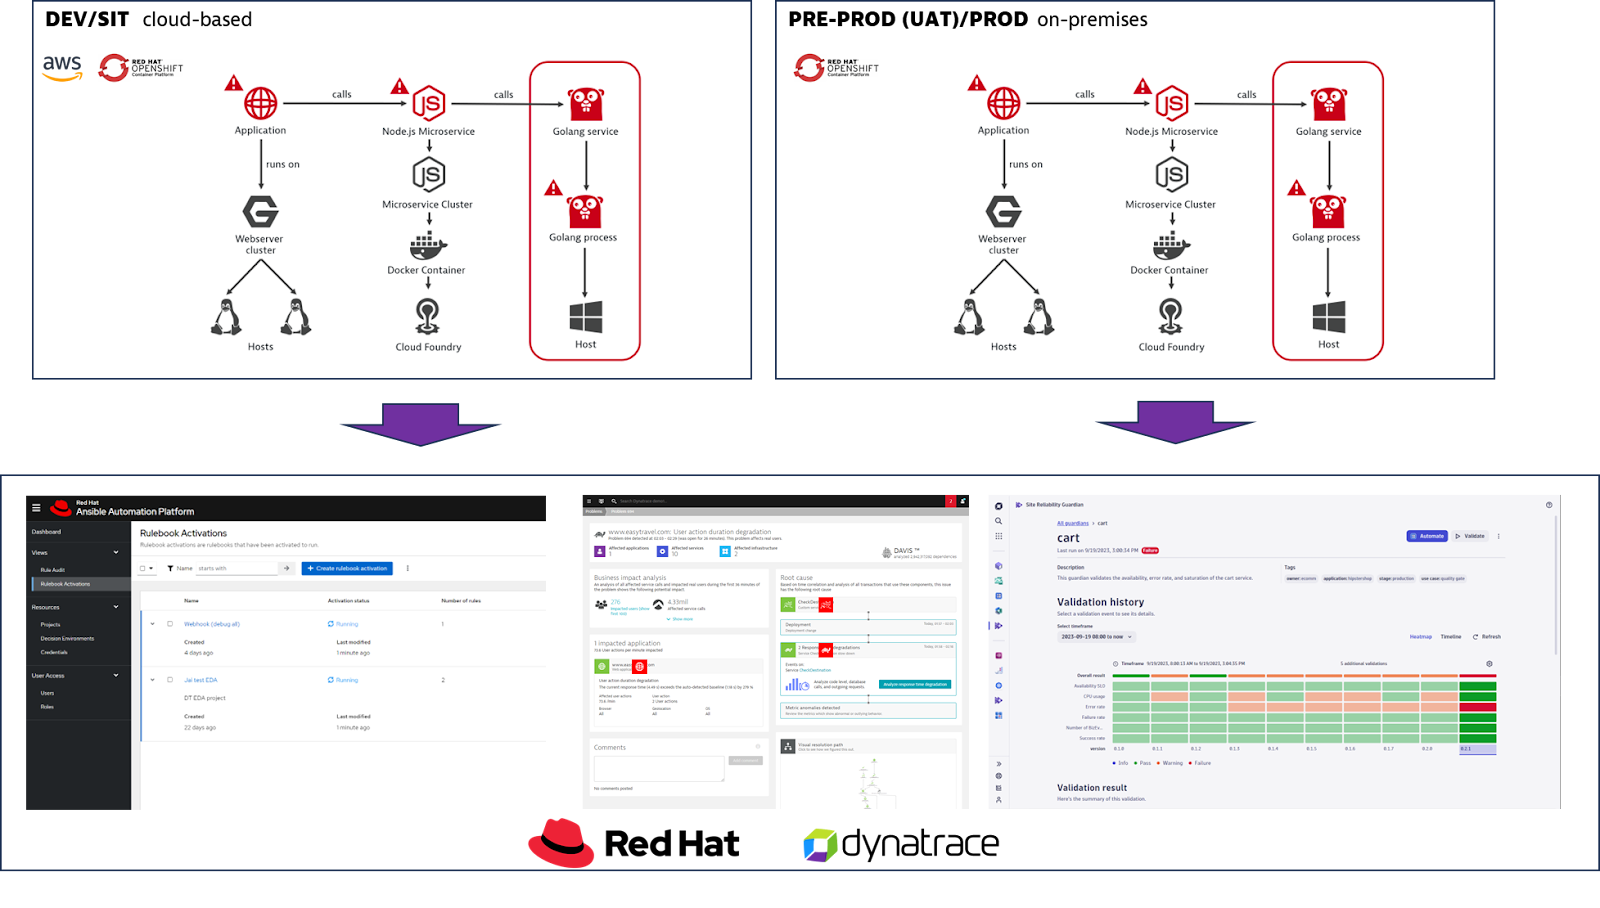
Example use-case
Our setup should have Development (DEV) and System Integration Testing (SIT) running on a hyperscaler. Just imagine the customer wants to use some fancy services on the hyperscaler side for development. But besides that, he also wants to drive functional tests. Maybe even headroom or performance tests. But for User Acceptance Testing (UAT) and Production (PR) he wants to get back on prem.
That means several applications are running on two different infrastructures in totally different network zones.
For these points it is important to monitor all systems relevant for my transaction end to end. Since a transaction can potentially touch a frontend, backend, middleware, database and many other parts which you want to monitor and the results consolidated in one place. Furthermore you want to be enabled to define so called events, for example a certain exception, which you later map to an action (e.g. Ansible playbook) to fix the problem.
Before we go to a high-level architecture showing how this could work, let’s spend some time on the different implementation options on the widespread implementation variants in enterprise customers environments.
Deployment and Implementation use-case
With different levels of data protection and cloud guidelines in enterprises and government in place, Red Hat and Dynatrace got you covered in all aspects of deployment, operating, monitoring, and analysing your software along your lifecycle in managed, on-premise, hybrid and cloud-based environments.
Both offerings, Red Hat and Dynatrace, can operate in an encapsulated managed environment or as SaaS-based offerings.
But in general, there are different implementation options which we want to elaborate high-level in the next section.
Implementation options
The combination of a Dynatrace SaaS based deployment model with Red Hat Event Driven Ansible unfolds leading key advantages for every customers:
Grail as leading data lakehouse with massively parallel processing (MPP) for logs, metrics, and events with security and business context.
DAVIS AI as the leading AI solution to identify problems, root causes, topology, and predictive analysis in combination with Dynatrace workflows to enrich any problem or security incident for smart remediation with Red Hat Ansible Automation Platform.
Please find detailed information around implementation options at the end of the blog.
Architecture overview
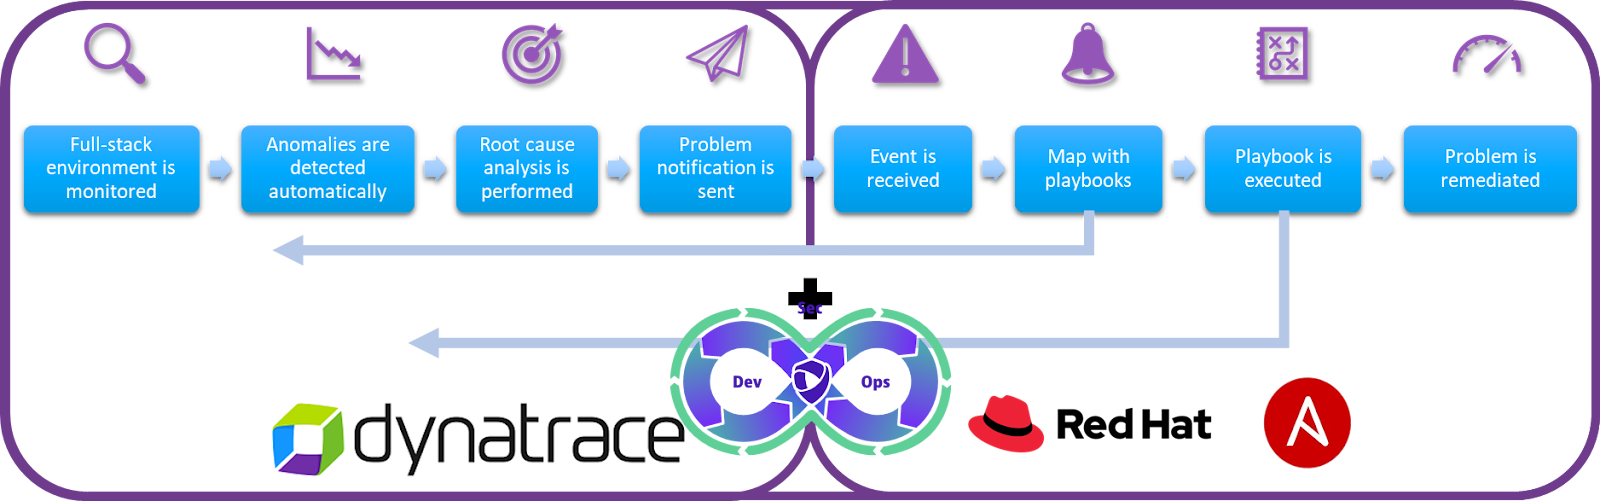
The integration of Dynatrace AutomationEngine-based workflows with Red Hat Ansible Automation Platform with Event-Driven Ansible provides customers the highest flexibility to remediate detected problems or to mitigate security vulnerabilities:
- Whether you are running your environment based on Red Hat Openshift, on-premises or cloud, traces, metrics, logs, security and business data are ingested via OneAgent or OpenTelemetry to Dynatrace enabling full-stack monitoring across your application landscape.
- Dynatrace Davis AI identifies anomalies and performs root cause analysis with a combination of predictive and causal AI.
- Dynatrace workflows allow you to amend data enrichment according to your needs, filter for relevant security vulnerabilities or problems, inform the correct users and hand over relevant data to Red Hat Ansible Automation Platform.
- Red Hat unique Event-Driven Ansible capability maps with rulebooks source events to the correct playbook
- and remediates a problem with a service restart, a rollback of a faulty deployment or a patch of a vulnerable component.
- Remediation progress and execution is exchanged with Dynatrace for a closed-loop remediation to validate the patch process and remediation success.
But let’s have a look at how such a workflow setup within Dynatrace could look like:
Example workflow setup within Dynatrace
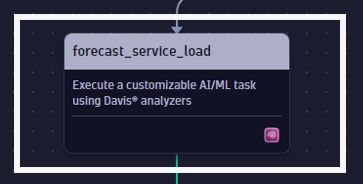
This example workflow is triggered by a security vulnerability, predicts service load to understand the impact and number of expected users, enriches information with root cause and topology information, retrieves ownership information to inform correct users and hands over a 360° view to Red Hat Ansible Automation Platform for further remediation scenarios:
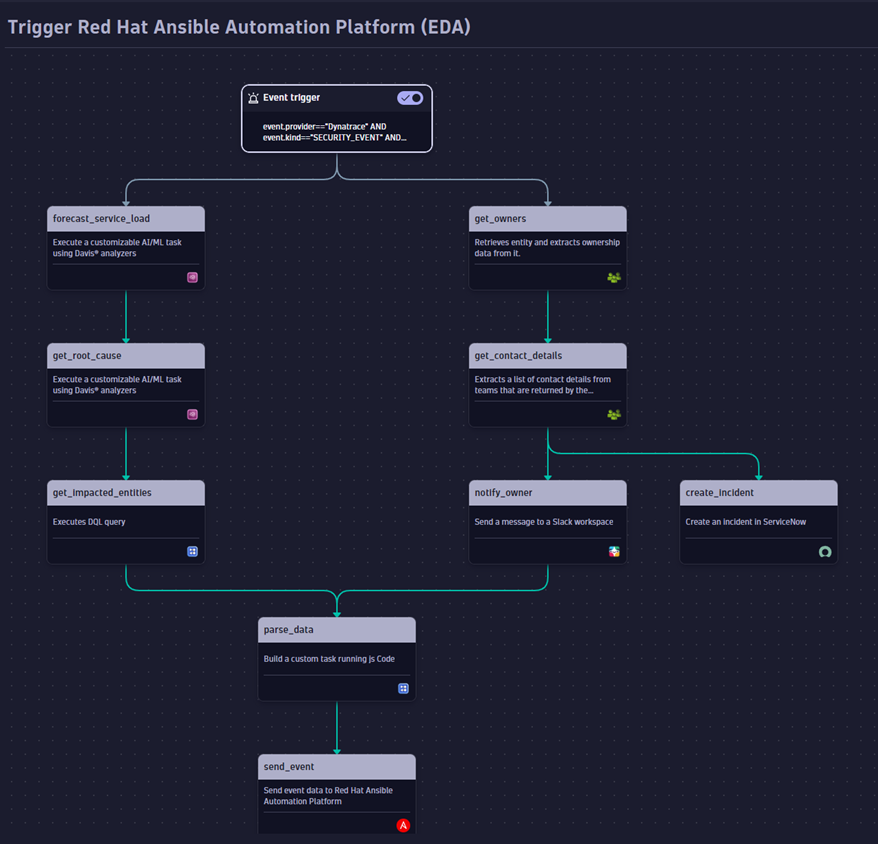
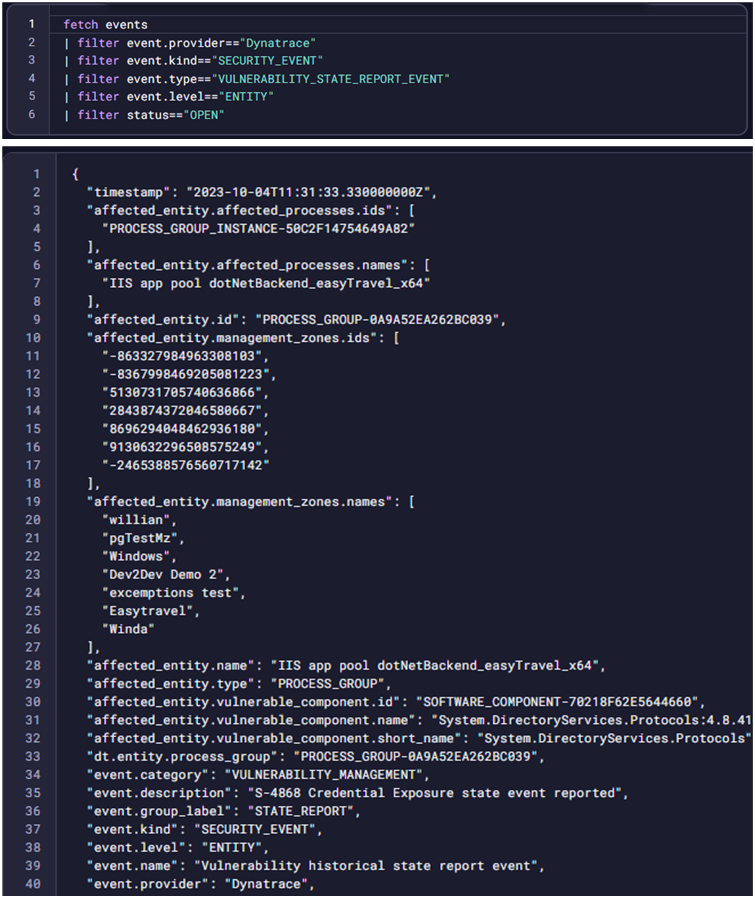
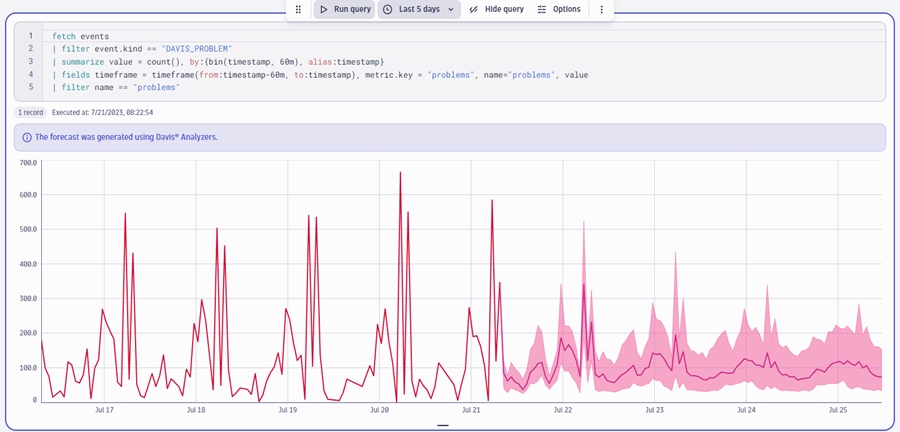
Dynatrace Query Language (DQL) is a powerful tool to explore your data and discover patterns, identify anomalies and outliers, create statistical modelling, and more based on data stored in Dynatrace Grail storage[3]. With DQL users can define the workflow trigger to initiate a required remediation process. The event payload contains problem details, vulnerability details, root cause, affected entities.
With Davis AI, predictive forecasts can be generated based on historic data and events, for example to predict service load or required disk space.
Ownership information simplifies targeted communication to inform users, escalate high risk security incidents and to create tickers in incident management systems like ServiceNow or Jira.
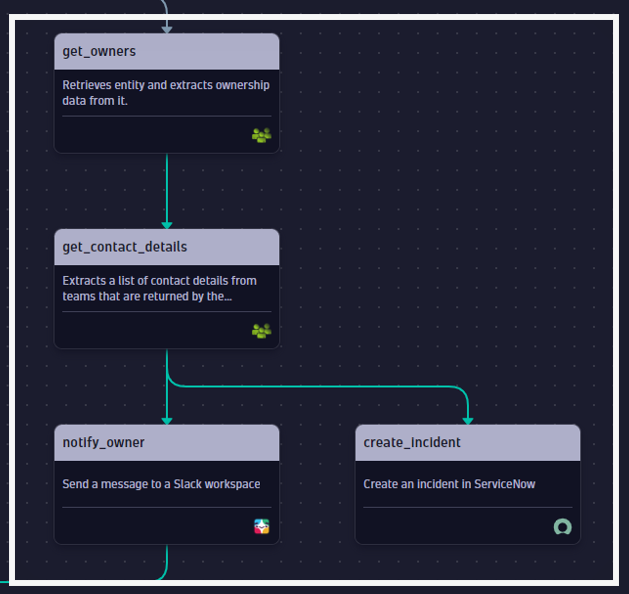
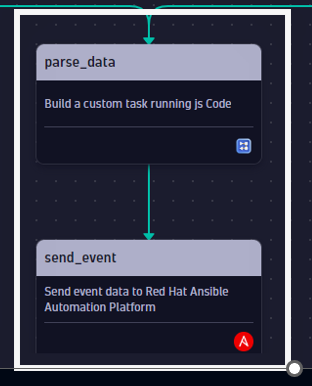
Problem or Security event data with its problem details, vulnerability details, root cause, affected entities is merged with additional information on forecasts and ownership information and is sent to Red Hat Ansible Automation Platform to initiate a remediation or patch process.
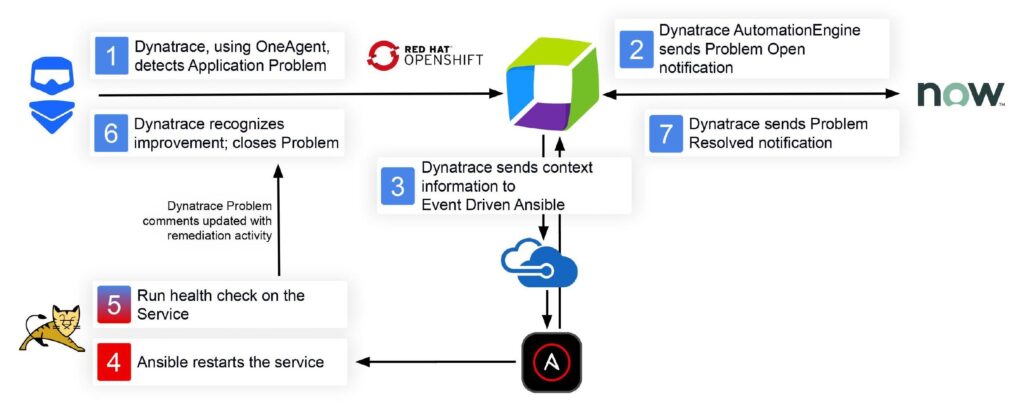
At the end of this technical part let’s have an end-to-end view on the flow of what would happen if you identify a service that is not working anymore. And as remediation you have configured an automated restart via Event-Driven Ansible.
Flow-diagram of an automated remediation example
At the end let’s put everything together in one simple flow diagram. In this example I have full transparency of all my applications through monitoring and I am discovering a failed service. I have an automated remediation action in place with the help of Event Driven Ansible[6] which will restart this failed service as a problem solution.
And this is exactly where this power play between Dynatrace and Event-Driven Ansible shows its potential.
Key takeaways
- Monitoring of your application landscape is not optional. Especially for a container adoption journey it is one of the key considerations you want to take care of
- Still 85% of organizations face challenges using observability because of structural borders. With solutions such as OpenShift to abstract all kinds of infrastructure types and Dynatrace you can achieve to overcome these challenges.
- Only the companies that steadily increase their operation efficiency stay competitive.
By seamlessly integrating the Red Hat OpenShift and Ansible offerings with Dynatrace analytics and automation platform, customers can significantly decrease manual effort and MTRS.
While at the average it takes a software developer 9 hours to remediate a problem within a production application, our customers have reduced their MTRS by up to 99% to identify a problem, create automatically incident tickets for compliance reasons, and remediate a problem like restarting, reconfiguring load balancers and restarting Tomcat servers.
Sources
[1] Dynatrace 2023 DevOps Automation Pulse Report (dynatrace.com)
[2] Partner Showcase: OpenShift App Observability with Dynatrace Operator (redhat.com)
[3] What is Dynatrace Grail data lakehouse? (dynatrace.com)
[4] Red Hat Ansible Automation Platform pricing and deployment options (redhat.com)
How to use Ansible Automation Platform from Azure Marketplace (developers.redhat.com)
[5] https://www.ansible.com/blog/announcing-containerized-ansible-automation-platform (ansible.com)
[6] Event-Driven Ansible Rulebooks (youtube)
Additional Links
OpenShift Ecosystem: Monitoring OpenShift Apps with Dynatrace (Part 1) (redhat.com)
OpenShift Ecosystem: Monitoring OpenShift Apps with Dynatrace (Part 2) (redhat.com)
Dynatrace on Red Hat Marketplace (marketplace.redhat.com)
Partner Showcase: OpenShift App Observability with Dynatrace Operator (redhat.com)
Partner Spotlight: Dynatrace (redhat.com)
How to gain Observability of Ansible Playbooks using OpenTelemetry (youtube)
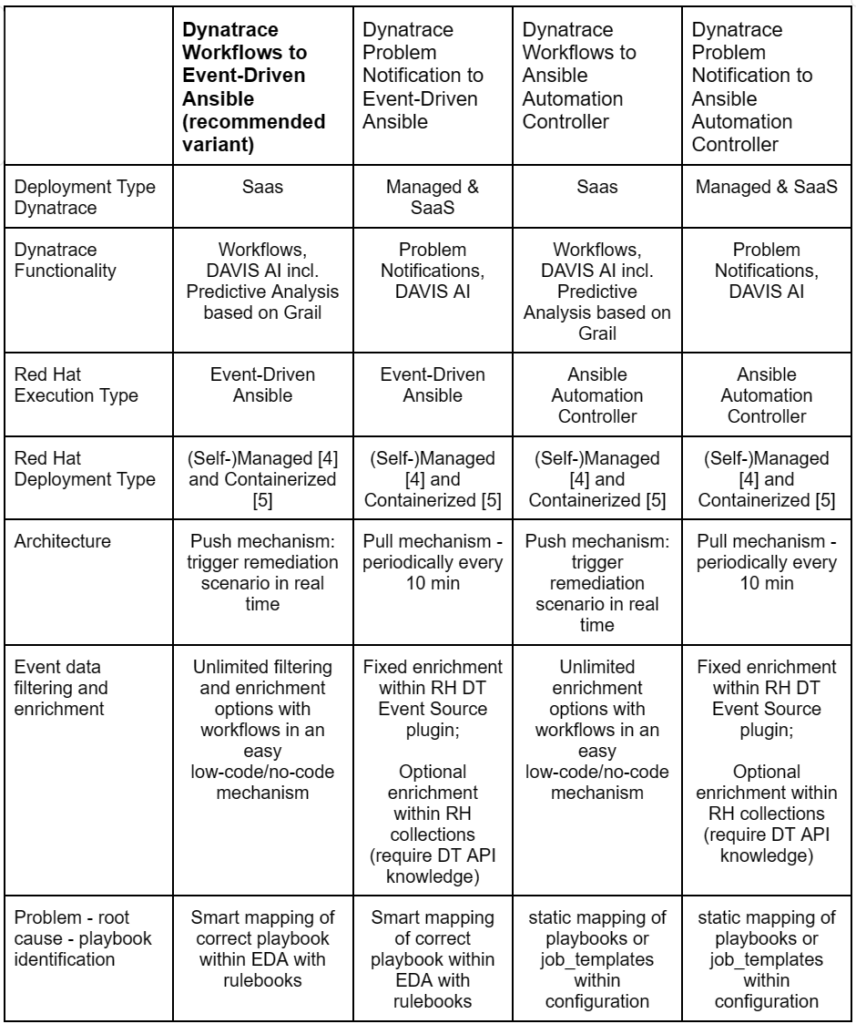
Implementation options details
The following table provides an overview of high-level pros and cons for different implementation options of Dynatrace and Red Hat Ansible Automation Platform:
Authors

Alexander Mohr
Dynatrace Austria, Senior Product Manager, leader in enterprise cloud/application monitoring and observability
LinkedIn

Michael Winkler
Dynatrace Austria, Senior Director Product Management
LinkedIn
X (formerly known as Twitter)
Github

Michael Siebert
Red Hat Switzerland, Associate Principal Solution Architect supporting Enterprise Consulting Business
LinkedIn
Co-Authors

Giri Venkataraman
Red Hat USA, Associate Principal Solution Architect, Global Ecosystem
LinkedIn

Josh Manning
Red Hat USA, Principal Software Engineer
LinkedIn
Reviewers

François Charette
Red Hat Germany, Senior Solution Architect Enterprise Vertical
LinkedIn

Götz Rieger
Red Hat Germany, Principal Solution Architect
LinkedIn

Matthias Breitschmid
Red Hat Switzerland, Senior Partner Manager, Consultants and Global- / Regional System Integrators
LinkedIn