
By Robert Baumgartner, Red Hat Austria, July 2025 (OpenShift 4.17, OpenShift Logging 6.1)
In the dynamic world of containerized applications and orchestrators like OpenShift, traditional logging approaches often fall short. Unlike static virtual machines or bare-metal servers where logs might reside in predictable file paths on a stable host, containers are ephemeral by nature. They can be spun up and torn down rapidly, scale horizontally, and run across a distributed cluster of nodes. This environment presents unique challenges for observability and troubleshooting. A robust logging stack, such as OpenShift Logging, becomes indispensable to address these complexities. It provides a unified approach to collecting, aggregating, and analyzing logs from a multitude of sources within an OpenShift cluster. This includes vital information from container images, detailed insights from cluster nodes, and critical events from the Kubernetes API server. Without such a centralized system, gaining visibility into application behavior, diagnosing issues, ensuring security, and maintaining compliance would be incredibly difficult, if not impossible, across a large and constantly changing container ecosystem.
OpenShift Logging with Loki Stack
For those familiar with previous iterations of OpenShift Logging, a significant shift has occurred. Previously, OpenShift Logging was based on the “ELK stack” – Elasticsearch for storage and indexing, Fluentd for log collection, and Kibana for visualization. The current OpenShift Logging solution, built on Vector and Loki, represents a modern evolution. The primary difference lies in the core logging engine:
Loki vs. Elasticsearch: Loki is fundamentally different from Elasticsearch. While Elasticsearch is a general-purpose search and analytics engine that indexes the full content of logs, Loki is designed specifically for logs and focuses on indexing only metadata (labels) associated with log streams. This “index-free” approach to log content makes Loki generally more cost-effective and simpler to operate for log aggregation, particularly at scale, as it avoids the overhead of indexing every word in every log line.
Vector vs. Fluentd: Vector replaces Fluentd as the log collector and forwarder in the new architecture. Both are capable log processors, but Vector is known for its high performance and unified configuration.
Integrated UI/Grafana vs. Kibana: While Kibana was the primary visualization tool for the ELK stack, the new OpenShift Logging integrates log viewing directly into the OpenShift console via a UI Plugin, and also offers robust integration with Grafana for advanced dashboarding. Grafana, in this context, provides a powerful and flexible interface for querying and visualizing Loki data, benefiting from OpenShift’s native authentication.
In essence, the transition to Loki and Vector offers a more specialized, potentially more performant, and resource-efficient logging solution tailored for the unique demands of OpenShift and containerized environments.
Key Advantages of a Logging Stack
A logging stack based on Loki has several advantages:
- Unified Log Collection: It provides a singular platform for collecting all types of logs – application, infrastructure, and audit – from diverse sources within your OpenShift cluster.
- Scalable Log Storage: The Loki Operator supports a wide range of object storage backends for the LokiStack, including popular cloud services like AWS S3, Azure, GCS, and MinIO, as well as OpenShift Data Foundation and Swift. This flexibility allows you to leverage existing storage infrastructure or choose the most cost-effective option for your needs.
- Flexible Sizing and High Availability: The Loki stack offers preconfigured sizes like 1x.demo for minimal deployments and 1x.pico for configurations that include high availability (HA) support for all Loki components, ensuring resilience for critical environments. Other sizes such as 1x.extra-small, 1x.small, and 1x.medium are also available, allowing you to tailor the deployment to your specific resource requirements.
- Optimized for Logs (Loki’s Design): Loki is designed to store and query logs by indexing metadata (labels) rather than the entire log content, which can make it very efficient for log aggregation and searching. Its architecture includes specialized components like the Gateway for request routing, Distributors for handling incoming streams, Ingesters for writing and querying in-memory data, Queriers for handling LogQL queries, and a Compactor for index optimization.
- Integrated OpenShift Console Experience: The Cluster Observability Operator enables the OpenShift console UIPlugin, providing a seamless experience for viewing log content directly within the OpenShift console. Users with appropriate permissions can easily filter logs by content, namespace, pod, container, severity, and log type, or define custom time ranges.
- Powerful Querying with LogQL: For advanced analysis, OpenShift Logging allows you to construct sophisticated queries using LogQL, Loki’s powerful query language. This enables highly specific searches and the creation of custom reports.
- Role-Based Access Control: The system intelligently integrates with OpenShift’s authentication, ensuring that non-admin users can primarily view logs related to their own applications, while cluster administrators retain full visibility into application, infrastructure, and audit logs. This adheres to a robust security model.
- Grafana Integration: You can integrate a Grafana dashboard to access Loki data, utilizing OpenShift’s OAuth for authentication. This allows for creating rich visualizations and dashboards based on your log data, leveraging Grafana’s extensive capabilities while maintaining OpenShift’s tenancy model.
Common Use Cases
The most common use cases served by a modern cloud-native logging stack are:
- Application Debugging and Troubleshooting: To quickly identify errors, trace requests, and understand application behavior by sifting through application logs.
- Infrastructure Monitoring: To gain insights into the health and performance of your cluster nodes and OpenShift components by analyzing infrastructure logs and journald messages.
- Security Auditing and Compliance: To monitor critical actions and track user activity within the cluster using detailed audit logs from auditd, kube-apiserver, openshift-apiserver, and ovn. The system can help you create reports on actions like who started or stopped a virtual machine.
- Resource Utilization Analysis: While not explicitly a core logging function, log patterns can indirectly reveal insights into resource consumption and performance bottlenecks.
- Event Persistence: With the optional Event Router, you can persist Kubernetes events, which are crucial for understanding cluster changes, lifecycle events, and historical context for incidents.
Installation and Configuration Guide
In the following, I will guide you on how to install Loki as storage for OpenShift Logging using MinIO as an object store, how to install and configure OpenShift Logging using the Loki stack, and finally how to leverage the OpenShift console UI Plugin for Logging to query and visualize logs. You need to be a cluster admin to follow this guide.
This document was prepared and tested on OpenShift 4.17. To follow the instructions provided below you should first locally clone my github repository rbaumgar/openshift-logging.
See also Configuring and using logging in OpenShift Container Platform for the official documentation.
Install Operators: OpenShift Logging, Loki, Observability Operator
First, install the required operators:
$ oc create -f operators/logging/operator-logging.yaml
namespace/openshift-logging created
operatorgroup.operators.coreos.com/openshift-logging-cqwll created
subscription.operators.coreos.com/cluster-logging created
$ oc create -f operators/loki/operator-loki.yaml
namespace/openshift-operators-redhat created
operatorgroup.operators.coreos.com/openshift-operators-redhat-mhrbh created
subscription.operators.coreos.com/loki-operator created$ oc create -f operators/coo/operator-coo.yaml
subscription.operators.coreos.com/cluster-observability-operator createdCheck that all operators are running and have reached the phase Succeeded. This may take a few minutes.
$ oc get csv -n openshift-logging cluster-logging.v6.1.0
NAME                      DISPLAY                     VERSION   REPLACES   PHASE
cluster-logging.v6.1.0    Red Hat OpenShift Logging   6.1.0                Succeeded

$ oc get csv -n openshift-operators-redhat loki-operator.v6.1.0
NAME                      DISPLAY                 VERSION   REPLACES   PHASE
loki-operator.v6.1.0      Loki Operator           6.1.0                Succeeded

$ oc get csv -n openshift-operators cluster-observability-operator.0.4.1
NAME                                   DISPLAY                          VERSION   REPLACES                               PHASE
cluster-observability-operator.0.4.1   Cluster Observability Operator   0.4.1     cluster-observability-operator.0.3.2   Succeeded
Configure the LokiStack
The Loki Operator supports AWS S3, Azure Blob, GCS, MinIO, OpenShift Data Foundation, and Swift for the LokiStack object storage.
Here is an example for an AWS S3 object store:
$ oc create secret generic logging-loki-s3
  --from-literal=bucketnames="<bucket_name>"
  --from-literal=endpoint="<aws_bucket_endpoint>"
  --from-literal=access_key_id="<aws_access_key_id>"
  --from-literal=access_key_secret="<aws_access_key_secret>"
  --from-literal=region="<aws_region_of_your_bucket>"
  -n openshift-logging
If you use a different object store, you should define the secret differently. See https://github.com/grafana/loki/blob/main/operator/docs/lokistack/object_storage.md
The Loki stack supports different predefined configuration sizes.
The 1x.demo configuration defines a single Loki deployment with minimal resource and limit requirements and no high availability (HA) support for all Loki components. This configuration is suitable for a demo environment.
The 1x.pico configuration defines a single Loki deployment with minimal resource and limit requirements. It offers high availability (HA) support for all Loki components. This configuration is suitable for deployments that do not require a single replication factor or auto-compaction.
Other available sizes are 1x.extra-small, 1x.small, and 1x.medium. See https://docs.redhat.com/en/documentation/openshift_container_platform/4.17/html-single/logging/index#log6x-loki-sizing_log6x-loki-6.1
In my provided operators/loki/lokistack.yaml, the spec.size is defined as 1x.demo.
The maximum supported retention period for Loki is 30 days.
To save space, the LokiStack retention period is here set to 3 days.
$ oc project openshift-logging

# find default storageclass
DEFAULT_STORAGECLASS=`kubectl get storageclasses.storage.k8s.io -o=jsonpath='{.items[?(@.metadata.annotations.storageclass.kubernetes.io/is-default-class=="true")].metadata.name}'`

$ cat <<EOF | oc apply -f -
apiVersion: loki.grafana.com/v1
kind: LokiStack
metadata:
  name: logging-loki
  namespace: openshift-logging
spec:
  tenants:
    mode: openshift-logging
  managementState: Managed
  limits:
    global:
      queries:
        queryTimeout: 3m
      retention:
        days: 3
  storage:
    schemas:
      - effectiveDate: '2024-10-11'
        version: v13
    secret:
      name: lokistack-loki-s3
      type: s3
  hashRing:
    type: memberlist
  size: 1x.demo
  storageClassName: $DEFAULT_STORAGECLASS
  replicationFactor: 1
EOF
lokistack.loki.grafana.com/logging-loki created
After applying the above, wait until all pods are running and the status of the CRD goes to ready.
$ oc get pod -l app.kubernetes.io/instance=logging-loki
NAME                                           READY   STATUS    RESTARTS   AGE
logging-loki-compactor-0                       1/1     Running   0          3d20h
logging-loki-distributor-55f9475cc6-jdhjb      1/1     Running   0          3d20h
logging-loki-gateway-778c49b997-dfzjc          2/2     Running   0          3d20h
logging-loki-gateway-778c49b997-k58v8          2/2     Running   0          3d20h
logging-loki-index-gateway-0                   1/1     Running   0          3d20h
logging-loki-ingester-0                        1/1     Running   0          3d20h
logging-loki-querier-55d7fbb758-222dw          1/1     Running   0          3d20h
logging-loki-query-frontend-754c4594c5-rmgww   1/1     Running   0          3d20h

$ oc get lokistacks.loki.grafana.com -o custom-columns=Status:status.conditions[0].message
Status
All components ready
If you select a size other than 1x.demo, multiple pods for the LokiStack will be created.
LokiStack Components
- Gateway: The gateway receives requests and redirects them to the appropriate container based on the request’s URL.
- Distributor: The distributor service is responsible for handling incoming streams by clients. Ingester: The ingester service is responsible for writing log data to long-term storage backends (DynamoDB, S3, Cassandra, etc.) on the write path and returning log data for in-memory queries on the read path.
- Query Frontend: internally performs some query adjustments and holds queries in an internal queue.
- Querier: handles queries using the LogQL query language, fetching logs both from the ingesters and from long-term storage.
- Compactor: a specific service that reduces the index size by deduping the index and merging all the files into a single file per table.
- Index Gateway: downloads and synchronizes the index from the Object Storage to serve index queries to the Queriers and Rulers over gRPC.
Configure the ClusterLogForwarder for LokiStack
In order to have the logs correctly routed to Loki, we need to configure the OpenShift ClusterLogForwarder appropriately, by doing each of these steps:
$ oc create sa collector
serviceaccount/collector created

$ oc adm policy add-cluster-role-to-user cluster-logging-write-application-logs -z collector
clusterrole.rbac.authorization.k8s.io/cluster-logging-write-application-logs added: "collector"

$ oc adm policy add-cluster-role-to-user cluster-logging-write-audit-logs -z collector
clusterrole.rbac.authorization.k8s.io/cluster-logging-write-audit-logs added: "collector"

$ oc adm policy add-cluster-role-to-user cluster-logging-write-infrastructure-logs -z collector
clusterrole.rbac.authorization.k8s.io/cluster-logging-write-infrastructure-logs added: "collector"

$ oc adm policy add-cluster-role-to-user collect-application-logs -z collector
clusterrole.rbac.authorization.k8s.io/collect-application-logs added: "collector"

$ oc adm policy add-cluster-role-to-user collect-audit-logs -z collector
clusterrole.rbac.authorization.k8s.io/collect-audit-logs added: "collector"

$ oc adm policy add-cluster-role-to-user collect-infrastructure-logs -z collector
clusterrole.rbac.authorization.k8s.io/collect-infrastructure-logs added: "collector"

$ oc apply -f operators/logging/clusterlogforwarder.yaml
clusterlogforwarder.observability.openshift.io/collector created
You only need to apply the roles for your required log types (application, audit, and infrastructure).
$ oc get clusterlogforwarders.observability.openshift.io collector --template='{{printf "%-55s %7s %-30sn" "Type" "Status" "Reason/Message"}}{{range .status.conditions}}{{printf "%-55s %7s %s/%sn" .type .status .reason .message}}{{end}}'
Type                                                     Status Reason/Message
observability.openshift.io/ValidLokistackOTLPOutputs       True ValidationSuccess/
observability.openshift.io/Authorized                      True ClusterRolesExist/permitted to collect log types: [application audit infrastructure]
observability.openshift.io/Valid                           True ValidationSuccess/
Ready                                                      True ReconciliationComplete/

# InputConditions
$ oc get clusterlogforwarders.observability.openshift.io collector --template='{{printf "%-55s %7s %-30sn" "Type" "Status" "Reason/Message"}}{{range .status.inputConditions}}{{printf "%-55s %7s %s/%sn" .type .status .reason .message}}{{end}}'
Type                                                     Status Reason/Message
observability.openshift.io/ValidInput-application          True ValidationSuccess/input "application" is valid
observability.openshift.io/ValidInput-infrastructure       True ValidationSuccess/input "infrastructure" is valid
observability.openshift.io/ValidInput-audit                True ValidationSuccess/input "audit" is valid

# OutputConditions
$ oc get clusterlogforwarders.observability.openshift.io collector --template='{{printf "%-72s %7s %-30sn" "Type" "Status" "Reason/Message"}}{{range .status.outputConditions}}{{printf "%-72s %7s %s/%sn" .type .status .reason .message}}{{end}}'
Type                                                                      Status Reason/Message
observability.openshift.io/ValidOutput-default-lokistack-application        True ValidationSuccess/output "default-lokistack-application" is valid
observability.openshift.io/ValidOutput-default-lokistack-audit              True ValidationSuccess/output "default-lokistack-audit" is valid
observability.openshift.io/ValidOutput-default-lokistack-infrastructure     True ValidationSuccess/output "default-lokistack-infrastructure" is valid

# PipelineCondition
$ oc get clusterlogforwarders.observability.openshift.io collector --template='{{printf "%-57s %7s %-30sn" "Type" "Status" "Reason/Message"}}{{range .status.pipelineConditions}}{{printf "%-57s %7s %s/%sn" .type .status .reason .message}}{{end}}'

$ oc get daemonsets.apps collector
NAME        DESIRED   CURRENT   READY   UP-TO-DATE   AVAILABLE   NODE SELECTOR            AGE
collector   6         6         6       6            6           kubernetes.io/os=linux   5d23h

$ oc get pod -l app.kubernetes.io/instance=collector
NAME              READY   STATUS    RESTARTS   AGE
collector-588b9   1/1     Running   0          3d19h
collector-88vc5   1/1     Running   0          3d19h
collector-bpj84   1/1     Running   0          3d19h
collector-fnbgr   1/1     Running   0          3d19h
collector-s858j   1/1     Running   0          3d19h
collector-scv4z   1/1     Running   0          3d19h
You can see that six collectors are running because one is on each node: 3 control plane nodes and 3 worker nodes.
Install the Cluster Observability Operator
The Cluster Observability Operator is required for the UI in the OpenShift console to display the log content.
$ oc apply -f operators/coo/uiplugin-logging.yaml
uiplugin.observability.openshift.io/logging created
Go to the OpenShift console and wait until the “refresh web console” option appears. Then, the UIPlugin will be available.
Viewing Logs as Cluster Admin
As a user with admin rights, you will find the logs under the Administrator menu and select Observe / Logs.
In the top row, a selection can be made for each of the following search criteria:
- content (search for a string within the log message)
- namespace
- pod
- container
- severity (critical, error, warning, debug, info, trace, and unknown)
- log type (application, infrastructure, and audit)
At the top right, a selection of the time range and the refresh interval is also possible. There are three log types that one can select:
- Application logs: Container logs are generated by user applications running in the cluster, except infrastructure container applications.

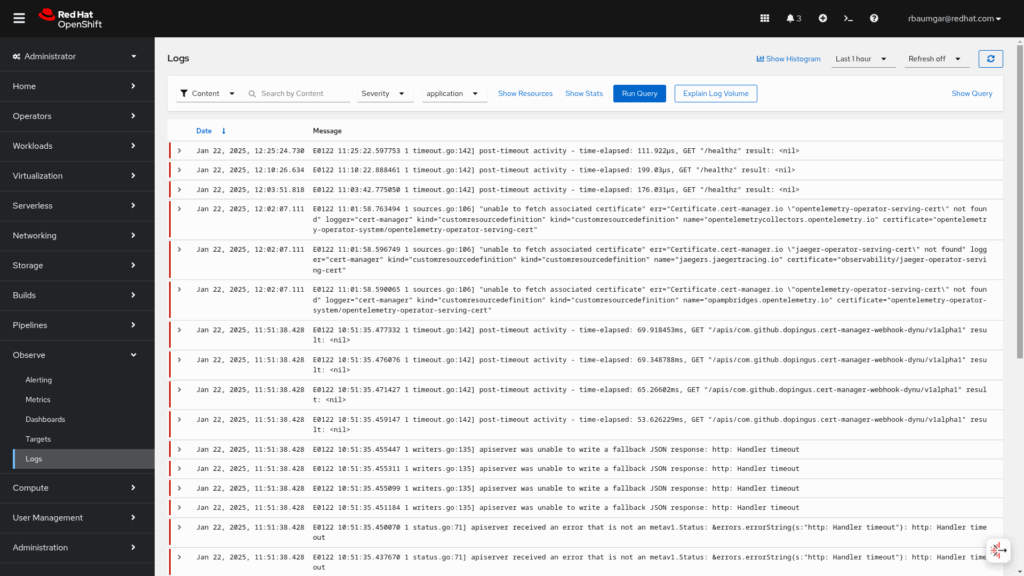
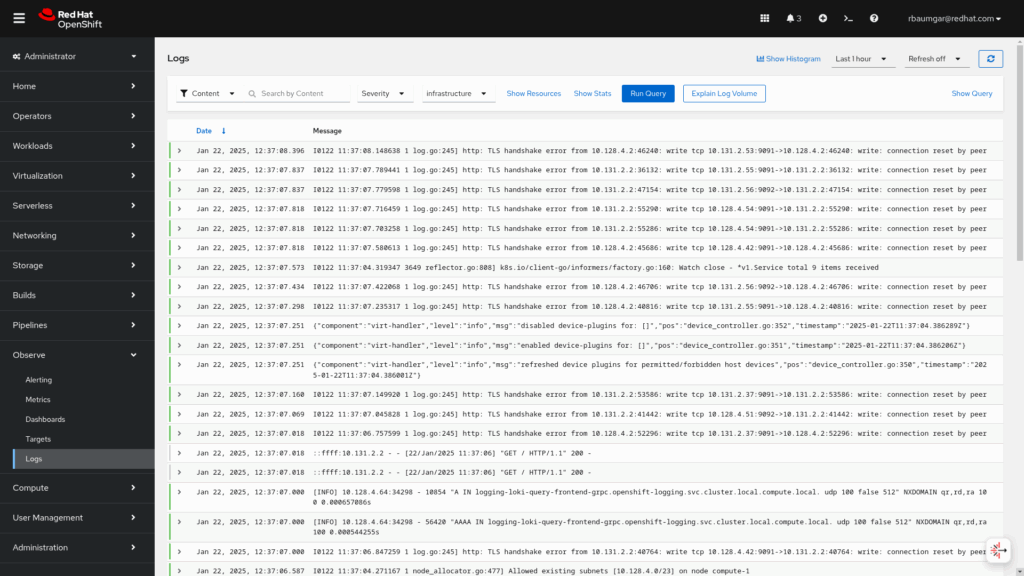
- Infrastructure logs: Container logs generated by infrastructure namespaces: openshift*, kube*, or default, as well as journald messages from nodes.

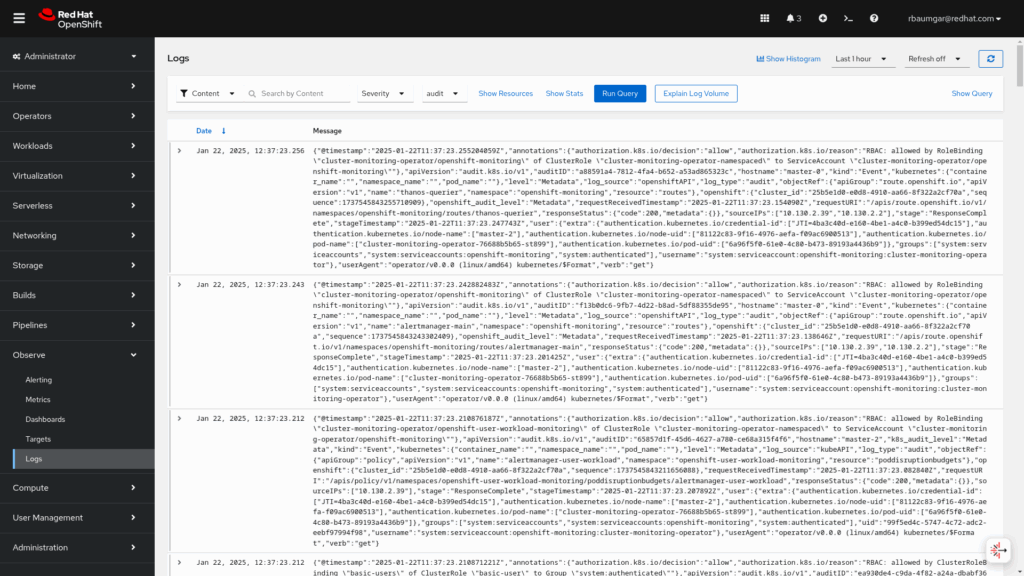
- Audit logs: Logs generated by
auditd, the node audit system, which are stored in the /var/log/audit/audit.log file, and logs from theauditd,kube-apiserver,openshift-apiserverservices, as well as the OVN project, if enabled.

By using the Show Query button, you can create your own query using LogQL, which is similar to the well-known PromQL query language.
Here are some examples.
All log entries from the namespace openshift-logging with the content grafana:
{ log_type="infrastructure", kubernetes_namespace_name="openshift-logging" } |= `grafana` | jsonAll log entries from the node log from the hostname master-0 with the content Started crio:
{ log_type="infrastructure"} |= `Started crio` | json | log_source="node" | hostname="master-0"All log entries from the namespace demo with the pod name and message:
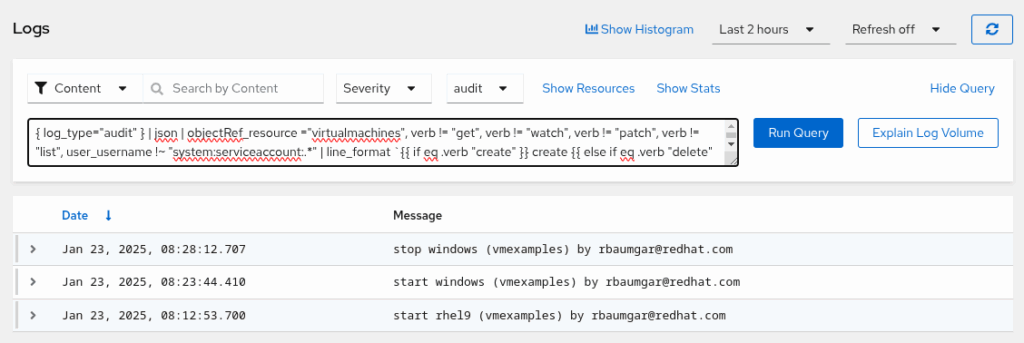
{kubernetes_namespace_name="demo"} | json | line_format `{{.kubernetes_pod_name}} {{.message}}`Create an audit report on who started, stopped, or changed any Virtual Machine, and when:
{ log_type="audit" } | json | objectRef_resource ="virtualmachines", verb != "get", verb != "watch", verb != "patch", verb != "list", user_username !~ "system:serviceaccount:.*" | line_format `{{ if eq .verb "create" }} create {{ else if eq .verb "delete" }} delete {{else}} {{ .objectRef_subresource }} {{end}} {{ .objectRef_name }} ({{ .objectRef_namespace }}) by {{ .user_username }}`
Show the console log of a Virtualmachine. Guest system logs has to be enabled either on the VM level or globally.
{ log_type="application", kubernetes_namespace_name="vmexamples", kubernetes_pod_name="virt-launcher-ubuntu-vj76m" , kubernetes_container_name = "guest-console-log"} | jsonShow all console logs of all Virtualmachine owned by . Guest system logs has to be enabled either on the VM level or globally.
{ log_type="application", kubernetes_namespace_name="vmexamples", kubernetes_container_name = "guest-console-log"} | json | {kubernetes_pod_owner= "VirtualMachineInstance/ubuntu" }The following labels are available in the application and infrastructure logs:
- kubernetes_container_name
- kubernetes_host
- kubernetes_namespace_name
- kubernetes_pod_name
- log_type
The following labels are available in the audit logs:
- kubernetes_host
- log_type
To find more details about Loki LogQL: Grafana Loki -> Query -> Log queries.
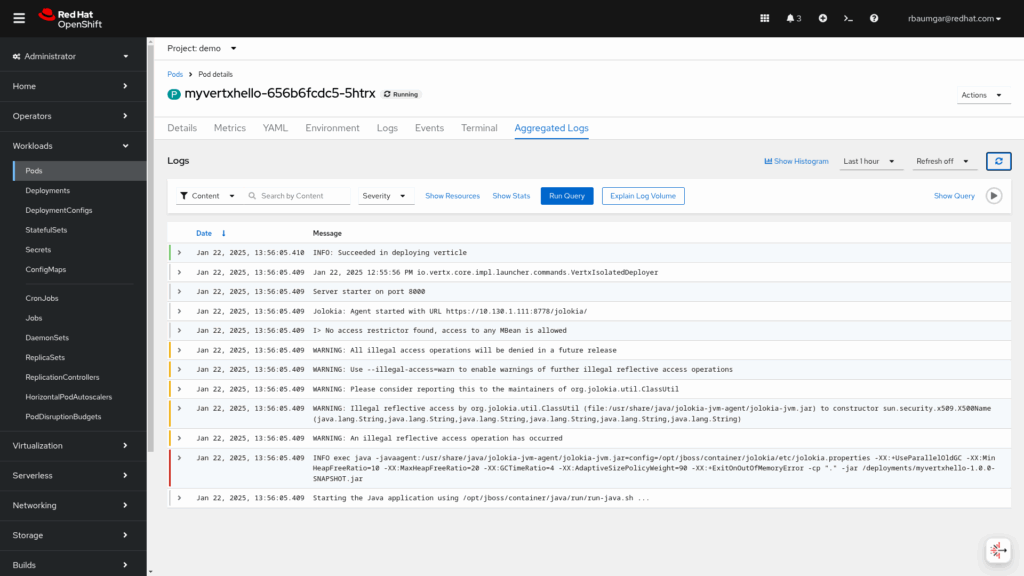
Viewing Logs as User
As a user without admin rights, you will find the logs under the Administrator menu, by selecting Workloads / Pods. When the pod is selected, there is a tab Aggregated Logs.

Another view is available under the Developer menu and select Observe and the Logs tab.

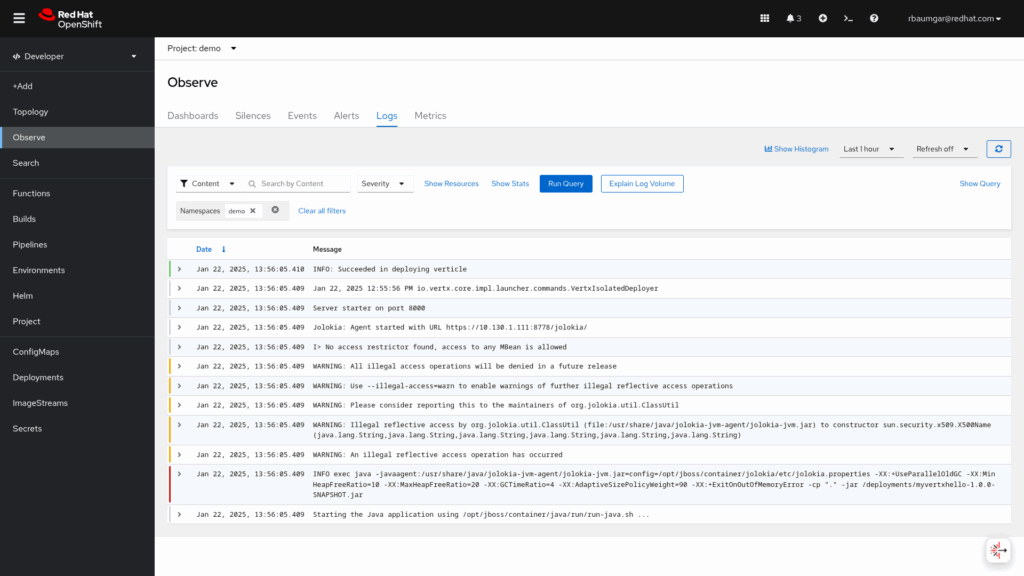
All messages in this namespace are displayed.
Wrap-up
This quickstart guide has walked you through the essential steps of setting up and utilizing OpenShift Logging with the Loki Stack. We’ve demonstrated how to install the necessary operators, configure the LokiStack with object storage, set up the ClusterLogForwarder for efficient log routing, and integrate the OpenShift console UI Plugin for intuitive log viewing. Furthermore, we’ve explored how both cluster administrators and regular users can effectively leverage the powerful LogQL for querying and analyzing logs. By following these steps, you can establish a robust, scalable, and cost-effective logging solution tailored for your containerized applications on OpenShift, significantly improving observability and troubleshooting capabilities.
Appendix
Create an Event Router
The Event Router extends this logging capability by explicitly addressing the need to persist the events of the OpenShift platform. The Event Router is a pod that watches Kubernetes events, collects them from all projects, writes them to its STDOUT, and then a collector forwards these events to the defined log store within the ClusterLogForwarder custom resource. This means you also get crucial platform-level events, providing a more complete picture of cluster activity. These collected events can then be viewed like other logs, for example, by checking the eventrouter-xxxx pod’s logs or in the OpenShift console.
$ oc process -f eventrouter/eventrouter.yaml | oc apply -n openshift-logging -f -
serviceaccount/eventrouter created
clusterrole.rbac.authorization.k8s.io/event-reader created
clusterrolebinding.rbac.authorization.k8s.io/event-reader-binding created
configmap/eventrouter created
deployment.apps/eventrouter created
More details can be found Collecting and storing Kubernetes events. Currently, it is missing in 4.17 documentation, but it is working as designed.
View the new Event Router pod:
$ oc get pods --selector  component=eventrouter -o name -n openshift-logging
pod/eventrouter-549f95c7d7-6fqqx
View the events collected by the Event Router:
$ oc logs deploy/eventrouter -n openshift-logging
{"verb":"ADDED","event":{"metadata":{"name":"redhat-operators-w8svm.1818dc6c594723df","namespace":"openshift-marketplace","uid":"6ba1e49b-082d-4e3d-a700-a9bcba9689b6","resourceVersion":"2810786987","creationTimestamp":"2025-01-08T23:46:54Z","managedFields":[{"manager":"kubelet","operation":"Update","apiVersion":"v1","time":"2025-01-08T23:46:54Z","fieldsType":"FieldsV1","fieldsV1":{"f:count":{},"f:firstTimestamp":{},"f:involvedObject":{},"f:lastTimestamp":{},"f:message":{},"f:reason":{},"f:reportingComponent":{},"f:reportingInstance":{},"f:source":{"f:component":{},"f:host":{}},"f:type":{}}}]},"involvedObject":{"kind":"Pod","namespace":"openshift-marketplace","name":"redhat-operators-w8svm","uid":"5f618733-bea2-422d-985f-00cd0afe18a1","apiVersion":"v1","resourceVersion":"2810786706","fieldPath":"spec.containers{registry-server}"},"reason":"Created","message":"Created container registry-server","source":{"component":"kubelet","host":"master-0"},"firstTimestamp":"2025-01-08T23:46:54Z","lastTimestamp":"2025-01-08T23:46:54Z","count":1,"type":"Normal","eventTime":null,"reportingComponent":"kubelet","reportingInstance":"master-0"}}
View the collected events in the console
Go to the Administrator view and select infrastructure and the pod eventrouter-xxxx.
Uninstall the Event Router
$ oc delete deployment, sa, cm eventrouter
deployment.apps "eventrouter" deleted
serviceaccount "eventrouter" deleted
configmap "eventrouter" deleted

$ oc delete clusterrolebinding event-reader-binding
clusterrolebinding.rbac.authorization.k8s.io "event-reader-binding" deleted
$ oc delete clusterrole event-reader
clusterrole.rbac.authorization.k8s.io "event-reader" deleted
Access the Loki data with a Grafana dashboard
The preferred option for accessing the data stored in Loki managed by loki-operator when running on OpenShift with the default OpenShift tenancy model is to go through the LokiStack gateway and do proper authentication against the authentication service included in OpenShift.
The configuration uses oauth-proxy to authenticate the user to the Grafana instance and forwards the token through Grafana to LokiStack’s gateway service. This enables the configuration to fully take advantage of the tenancy model so that users can only see the logs of their applications and only admins can view infrastructure and audit logs.
As the open-source version of Grafana does not support limiting data sources to certain groups of users, all data sources (“application”, “infrastructure”, and “audit”) will be visible to all users. The infrastructure and audit data sources will not yield any data for non-admin users.
Keep in mind that the configuration points to the Loki Gateway server (GATEWAY_ADDRESS). This contains the Lokistack name (logging-loki). If you have changed, replace it with the correct name.
Deploy the Grafana server
$ oc apply -f grafana/grafana_gateway_ocp_oauth.yaml
serviceaccount/grafana created
clusterrolebinding.rbac.authorization.k8s.io/logging-grafana-auth-delegator created
configmap/grafana-config created
configmap/grafana-datasources created
service/grafana created
deployment.apps/grafana created
route.route.openshift.io/grafana created
Go to the Grafana route and login with an OpenShift user.
# get Grafana URL
$ oc get route grafana -o jsonpath='{.spec.host}'
grafana-openshift-logging.apps.rbaumgar.demo.net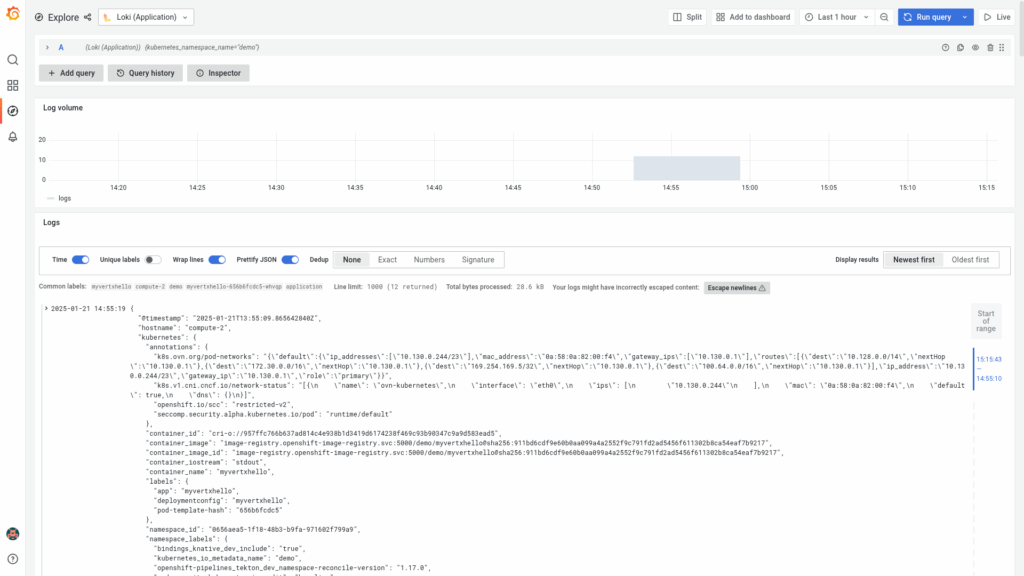
Uninstall Grafana
$ oc delete deployment,svc,route grafana
deployment.apps "grafana" deleted
service "grafana" deleted
route.route.openshift.io "grafana" deleted

$ oc delete cm grafana-config grafana-datasources
configmap "grafana-config" deleted
configmap "grafana-datasources" deleted

$ oc delete sa grafana
serviceaccount "grafana" deleted

$ oc delete ClusterRoleBinding logging-grafana-auth-delegator
clusterrolebinding.rbac.authorization.k8s.io "logging-grafana-auth-delegator" deleted
Uninstall Logging Stack
$ oc projct openshift-logging

# Observability Operator
$ oc delete uiplugins.observability.openshift.io logging
uiplugin.observability.openshift.io "logging" deleted

# if no other UIPlugin is installed delete operator
$ oc delete subscriptions.operators.coreos.com -n openshift-operators cluster-observability-operator
subscription.operators.coreos.com "cluster-observability-operator" deleted

$ oc delete csv -n openshift-operators cluster-observability-operator.0.4.1
clusterserviceversion.operators.coreos.com "cluster-observability-operator.0.4.1" deleted

$ oc delete crd uiplugins.observability.openshift.io
customresourcedefinition.apiextensions.k8s.io "uiplugins.observability.openshift.io" deleted

# OpenShift Logging Operator

$ oc delete clusterlogforwarders.observability.openshift.io collector
clusterlogforwarder.observability.openshift.io "collector" deleted

$ oc delete subscriptions.operators.coreos.com cluster-logging
subscription.operators.coreos.com "cluster-logging" deleted

$ oc delete csv cluster-logging.v6.1.0
clusterserviceversion.operators.coreos.com "cluster-logging.v6.1.0" deleted

$ oc delete crd logfilemetricexporters.logging.openshift.io
                clusterlogforwarders.observability.openshift.io
customresourcedefinition.apiextensions.k8s.io "logfilemetricexporters.logging.openshift.io" deleted
customresourcedefinition.apiextensions.k8s.io "clusterlogforwarders.observability.openshift.io" deleted

# Loki Operator
$ oc delete lokistacks.loki.grafana.com logging-loki
lokistack.loki.grafana.com "logging-loki" deleted

$ oc delete subscriptions.operators.coreos.com -n openshift-operators-redhat loki-operator
subscription.operators.coreos.com "loki-operator" deleted

$ oc delete csv -n openshift-operators-redhat loki-operator.v6.1.0
clusterserviceversion.operators.coreos.com "loki-operator.v6.1.0" deleted

$ oc delete pvc -l app.kubernetes.io/instance=logging-loki
persistentvolumeclaim "storage-logging-loki-compactor-0" deleted
persistentvolumeclaim "storage-logging-loki-index-gateway-0" deleted
persistentvolumeclaim "storage-logging-loki-ingester-0" deleted
persistentvolumeclaim "wal-logging-loki-ingester-0" deleted

$ oc delete crd alertingrules.loki.grafana.com
                lokistacks.loki.grafana.com
                recordingrules.loki.grafana.com
                rulerconfigs.loki.grafana.com
customresourcedefinition.apiextensions.k8s.io "alertingrules.loki.grafana.com" deleted
customresourcedefinition.apiextensions.k8s.io "lokistacks.loki.grafana.com" deleted
customresourcedefinition.apiextensions.k8s.io "recordingrules.loki.grafana.com" deleted
customresourcedefinition.apiextensions.k8s.io "rulerconfigs.loki.grafana.com" deleted
PodDisruptionBudget
When you install the Loki stack with the 1x.demo size, you will get a PodDisruptionBudget definition. But all pods are at the minimum availability.
$ oc get pdb -l app.kubernetes.io/instance=logging-loki
NAME                          MIN AVAILABLE   MAX UNAVAILABLE   ALLOWED DISRUPTIONS   AGE
logging-loki-compactor        1               N/A               0                     4d17h
logging-loki-distributor      1               N/A               0                     4d17h
logging-loki-gateway          1               N/A               1                     4d17h
logging-loki-index-gateway    1               N/A               0                     4d17h
logging-loki-ingester         1               N/A               0                     4d17h
logging-loki-querier          1               N/A               0                     4d17h
logging-loki-query-frontend   1               N/A               0                     4d17h
On this see the following Knowledge Base article: Not able to drain a node when running LokiStack with size 1x.demo in RHOCP 4.
As a workaround, just delete the PDBs.
$ oc delete pdb -l app.kubernetes.io/instance=logging-loki
poddisruptionbudget.policy "logging-loki-distributor" deleted
poddisruptionbudget.policy "logging-loki-gateway" deleted
poddisruptionbudget.policy "logging-loki-index-gateway" deleted
poddisruptionbudget.policy "logging-loki-ingester" deleted
poddisruptionbudget.policy "logging-loki-querier" deleted
poddisruptionbudget.policy "logging-loki-query-frontend" deleted