Machine Learning models are developed, trained and deployed within more and more intelligent applications. Most of the modern applications are developed as cloud-native applications and deployed on Kubernetes. There are several ways to serve your ML model so that application components can call a prediction REST web service. Seldon Core is a framework that makes it easy to deploy ML models. The Seldon Core metric functionality is an important feature for operational model performance monitoring and can support you observing potential model drift.
In this blog post we are going to explore how to deploy and monitor ML models on OpenShift Kubernetes using Seldon Core, Prometheus and Grafana.
Topics
- Install Seldon Core, Prometheus and Grafana
- Deploy ML models, scrape and graph operational metrics
- Scrape and graph custom metrics
- Troubleshooting
Approach
After installing Seldon Core, Prometheus and Grafana on your OpenShift Kubernetes cluster, we will walk through several basic examples. The machine learning models used here are very simple and just examples for working with metrics.
A basic understanding of OpenShift Kubernetes, Operators, machine learning and git is most likely needed to follow along. Please clone the git repo openshift-tutorials on your computer and switch to the directory ml-monitoring.
Additionally, please ensure that you have privileges to deploy and configure operators on your OpenShift cluster. The examples should work fine on Red Hat CodeReady Containers as well.
Install Seldon Core, Prometheus and Grafana
Below are step-by-step instructions for installing and configuring Seldon Core, Prometheus and Grafana. Alternatively, you can install these components with Open Data Hub.
Login into OpenShift and create a new project:
oc new-project ml-monCode language: JavaScript (javascript)Install the Operators
Install the Operators for Seldon Core, Promentheus and Grafana via the OperatorHub in OpenShift Console or using oc CLI and the operator subscriptions in the operator directory. E.g.
oc apply -k operator/Sample output:
operatorgroup.operators.coreos.com/ml-mon created
subscription.operators.coreos.com/grafana-operator created
subscription.operators.coreos.com/prometheus created
subscription.operators.coreos.com/seldon-operator created
In OpenShift Console under Installed Operators you should see the following:

Create a Prometheus instance and route
Now, create a Prometheus instance and route with by applying the following manifests:
oc apply -f prometheus-instance.yaml
oc apply -f prometheus-route.yamlCode language: CSS (css)
Check if your Prometheus instance is running by navigating in the OpenShift Console to `Networking` -> `Routes` and clicking on the Prometheus URL.
Configure Grafana
Create a Grafana instance:
oc apply -f grafana-instance.yamlCode language: CSS (css)Your Grafana instance should be connected to you Prometheus instance as datascourde
Therefore, create a Grafana datasource for Prometheus:
oc apply -f grafana-prometheus-datasource.yamlCode language: CSS (css)Check the route and get the URL for the Grafana dashboard:
oc get routes -o nameCode language: JavaScript (javascript)Sample output:
route.route.openshift.io/grafana-route
route.route.openshift.io/prometheus
Get the URL:
echo http://$(oc get route grafana-route -n ml-mon -o jsonpath='{.spec.host}')Code language: PHP (php)Sample output:
http://grafana-route-ml-mon.apps-crc.testingCode language: JavaScript (javascript)In case everything went fine, you should see the “Welcome to Grafana” page.
Deploy ML models, scrape and graph operational metrics
This this section we will use examples from SeldonIO to deploy ML models, scrape and graph operational metrics.
Ensure you are in the right namespace:
oc project ml-monDeploy the Seldon Core Grafana Dashboard
The Grafana Operator exposes an API for Dashboards. Let’s apply the Prediction Analytics dashboard:
oc apply -f prediction-analytics-seldon-core-1.2.2.yamlCode language: CSS (css)Open Grafana and have a look the Prediction Analytics dashboard. No data is available yet:
Explore Seldon operational metrics
Few steps are needed to see operational metrics:
- Deploy a ML model using Seldon
- Expose the prediction service
- Deploy a Prometheus Service Monitor
- Generate load for the prediction service and view the dashboard
Deploy a ML model using Seldon
We will use an example from Seldon Core:
oc apply -f https://raw.githubusercontent.com/SeldonIO/seldon-core/release-1.2.2/notebooks/resources/model_seldon_rest.yamlCode language: JavaScript (javascript)Wait until the pod is deployed:
oc get podsCode language: JavaScript (javascript)Sample output:
NAME                                              READY   STATUS    RESTARTS   AGE
...
rest-seldon-model-0-classifier-5594bd9d49-pld7s   2/2     Running   0          91m
...
Expose and test the prediction service
The deployment of the model created a service too.
Expose the created service so that we can test the prediction:
oc expose service rest-seldon-modelNote, Seldon created two services: rest-seldon-model and rest-seldon-model-classifier. We will use here the service rest-seldon-model, because it points to the seldon engine and we have to use the seldon engine to make metrics available for Prometheus.
Test the prediction service:
curl -H "Content-Type: application/json" -d '{"data": {"ndarray":[[1.0, 2.0, 5.0]]}}' -X POST http://$(oc get route rest-seldon-model -o jsonpath='{.spec.host}')/api/v1.0/predictions Code language: JavaScript (javascript)Sample output:
{"data":{"names":["proba"],"ndarray":[[0.43782349911420193]]},"meta":{}}Code language: JSON / JSON with Comments (json)The prediction works and the result is 0.437.
Deploy a Prometheus Service Monitor
Next we will instruct Prometheus to gather Seldon-core metrics for the model. This is done with a Prometheus Service Monitor:
oc apply -f rest-seldon-model-servicemonitor.yamlCode language: CSS (css)The Service Monitor is going to find the service with the label seldon-app=rest-seldon-model and scrape metrics from /prometheus at port http.
Here a snippet of the servicemonitor:
...
spec:
  endpoints:
  - interval: 30s
    path: /prometheus
    port: http
  selector:
    matchLabels:
      seldon-app: rest-seldon-model
Generate load for the prediction service and view the dashboard
Generate some load for the prediction service to have metric data on the dashboard:
while true
do
curl -H "Content-Type: application/json" -d '{"data": {"ndarray":[[1.0, 2.0, 5.0]]}}' -X POST http://$(oc get route rest-seldon-model -o jsonpath='{.spec.host}')/api/v1.0/predictions
sleep 2
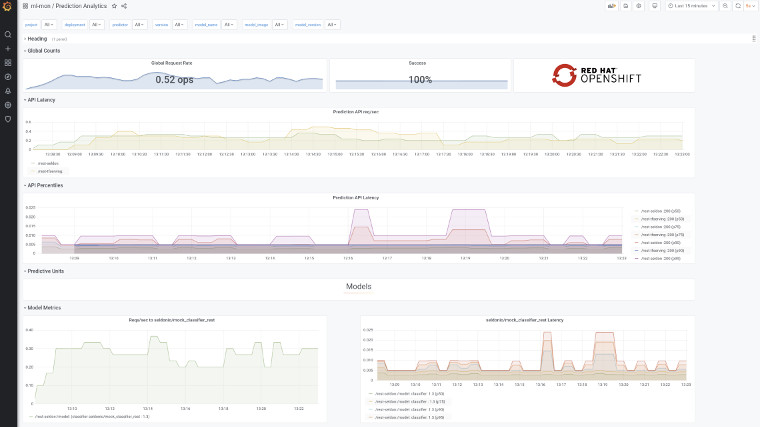
doneCode language: JavaScript (javascript)The Grafana Prediction Analytics dashboard will start showing some data:

Deploy and monitor a Tensorflow model
Let us repeat the lab with a Tensorflow model from Seldon Core:
Deploy a ML model using Seldon
oc apply -f https://raw.githubusercontent.com/SeldonIO/seldon-core/release-1.2.2/notebooks/resources/model_tfserving_rest.yamlCode language: JavaScript (javascript)Wait until the pod is deployed:
oc get podsCode language: JavaScript (javascript)Sample output:
rest-tfserving-model-0-halfplustwo-7c6c67fcbc-q6rrk 2/2 Running 0 107sExpose and test the prediction service
Expose the created service so that we can test the prediction.
oc expose service rest-tfserving-modelNote, Seldon created two services: rest-tfserving-model and rest-tfserving-model-halfplustwo. We will use here the service rest-tfserving-model, because it point to the seldon engine so that we see metrics.
Test the prediction service:
curl -H "Content-Type: application/json" -d '{"instances": [1.0, 2.0, 5.0]}' -X POST http://$(oc get route rest-tfserving-model -o jsonpath='{.spec.host}')/v1/models/halfplustwo/:predictCode language: JavaScript (javascript)Sample output:
{
    "predictions": [2.5, 3.0, 4.5
    ]
}Code language: JSON / JSON with Comments (json)
The prediction works fine!
Deploy a Prometheus Service Monitor
Now we will instruct Prometheus to gather Seldon-core metrics for the model. This is done with a Prometheus Service Monitor:
oc apply -f rest-tfserving-model-servicemonitor.yamlCode language: CSS (css)The Service Monitor is going to find the service with the label rest-tfserving-model and scrape metrics from /prometheus at port http. Here a snippet of the servicemonitor:
spec:
  endpoints:
  - interval: 30s
    path: /prometheus
    port: http
  selector:
    matchLabels:
      seldon-app: rest-tfserving-model
Generate load on the service and view the dashboard
Next, generate some load to see data on the dashboard:
while true
do
  curl  -H "Content-Type: application/json" -d '{"instances": [1.0, 2.0, 5.0]}' -X POST http://$(oc get route rest-tfserving-model -o jsonpath='{.spec.host}')/v1/models/halfplustwo/:predict
  sleep 2
doneCode language: JavaScript (javascript)
The Grafana Prediction Analytics dashboard will start showing the Tensorflow data. You might have to reload the dashboard.
Scrape and graph custom metrics
With custom metrics you can expose any metrics from your model. For example you cloud expose features and predictions for model drift monitoring.
Again, let’s repeat the lab with a model from Seldon Core.
Deploy the model and dashboard
Deploy the example model with custom metrics:
oc apply -f https://raw.githubusercontent.com/SeldonIO/seldon-core/v1.2.2/examples/models/custom_metrics/model_rest.yamlCode language: JavaScript (javascript)Deploy a custom dashboard:
oc apply -f custom-metrics-dashboard.yamlCode language: CSS (css)Open Grafana and have a look the Custom Metrics dashboard. No data is available yet:
Expose the service and test
oc expose service seldon-model-exampleTest the prediction service:
curl -s -d '{"data": {"ndarray":[[1.0, 2.0, 5.0]]}}' -X POST http://$(oc get route seldon-model-example -o jsonpath='{.spec.host}')/api/v1.0/predictions -H "Content-Type: application/json"Code language: JavaScript (javascript)Sample output with custom metrics in “meta”:
{"data":{"names":["t:0","t:1","t:2"],"ndarray":[[1.0,2.0,5.0]]},"meta":{"metrics":[{"key":"mycounter","type":"COUNTER","value":1},{"key":"mygauge","type":"GAUGE","value":100},{"key":"mytimer","type":"TIMER","value":20.2}]}}Code language: JSON / JSON with Comments (json)Have a look at the meta data above.
Scrape custom metrics
Note, custom metrics are expose by the predictor (not the engine) at port 6000.
Therefore, add a service for port 6000:
oc apply -f seldon-model-example-classifier-metrics-service.yaml Code language: CSS (css)And add a service monitor for the custom metrics:
oc apply -f seldon-model-example-classifier-servicemonitor.yamlCode language: CSS (css)Create a bit of load:
for i in 1 2 3 4 5
do

  curl -s -d '{"data": {"ndarray":[[1.0, 2.0, 5.0]]}}'    -X POST http://$(oc get route seldon-model-example -o jsonpath='{.spec.host}')/api/v1.0/predictions    -H "Content-Type: application/json"
  sleep 1
doneCode language: JavaScript (javascript)
The Custom Metrics dashboard will (hopefully) show the data. If not, set the time range of the Grafana dashboard to Last 15 minutes.

So, we saw operational and custom metrics in the Grafana Dashboards. You can now apply these concepts to your ML model serving.
Troubleshooting
Missing data?
In case your data is not showing up in Grafana, please check first in Prometheus if the metrics and data exist.

Internal error occurred: failed calling webhook “v1.mseldondeployment.kb.io”
Deinstalling the Seldon Operator leaves webhookconfiguration behind, which cause trouble when you deploy a seldon deployment for a newly deployed operator.
For example:
oc apply -f https://raw.githubusercontent.com/SeldonIO/seldon-core/release-1.2.2/notebooks/resources/model_seldon_rest.yamlCode language: JavaScript (javascript)Sample output:
Error from server (InternalError): error when creating "https://raw.githubusercontent.com/SeldonIO/seldon-core/release-1.2.2/notebooks/resources/model_seldon_rest.yaml": Internal error occurred: failed calling webhook "v1.mseldondeployment.kb.io": Post https://seldon-webhook-service.manuela-ml-workspace.svc:443/mutate-machinelearning-seldon-io-v1-seldondeployment?timeout=30s: service "seldon-webhook-service" not foundCode language: JavaScript (javascript)A previous deployment of the Seldon Operator in manuela-ml-workspace causes the trouble.
Let’s find and delete the WebhookConfiguration. E.g.,
oc get -o name MutatingWebhookConfiguration,ValidatingWebhookConfiguration -A | grep manuelaCode language: JavaScript (javascript)Sample output:
mutatingwebhookconfiguration.admissionregistration.k8s.io/seldon-mutating-webhook-configuration-manuela-ml-workspace

validatingwebhookconfiguration.admissionregistration.k8s.io/seldon-validating-webhook-configuration-manuela-ml-workspace
Now delete …
oc delete mutatingwebhookconfiguration.admissionregistration.k8s.io/seldon-mutating-webhook-configuration-manuela-ml-workspace

oc delete validatingwebhookconfiguration.admissionregistration.k8s.io/seldon-validating-webhook-configuration-manuela-ml-workspaceCode language: JavaScript (javascript)