The Problem
It’s getting worse. Every day. The global emissions of carbon dioxide are still increasing 1, while our global budget to stay in the range of 1.5° C and 2° C is rapidly exhausting2.
The main emissions are produced by burning fossil fuels for energy generation, transportation and industrial production. Another big source of carbon emission is coming from chemical processes like cement or steel production. Third big contribution is coming from agriculture and food processing:
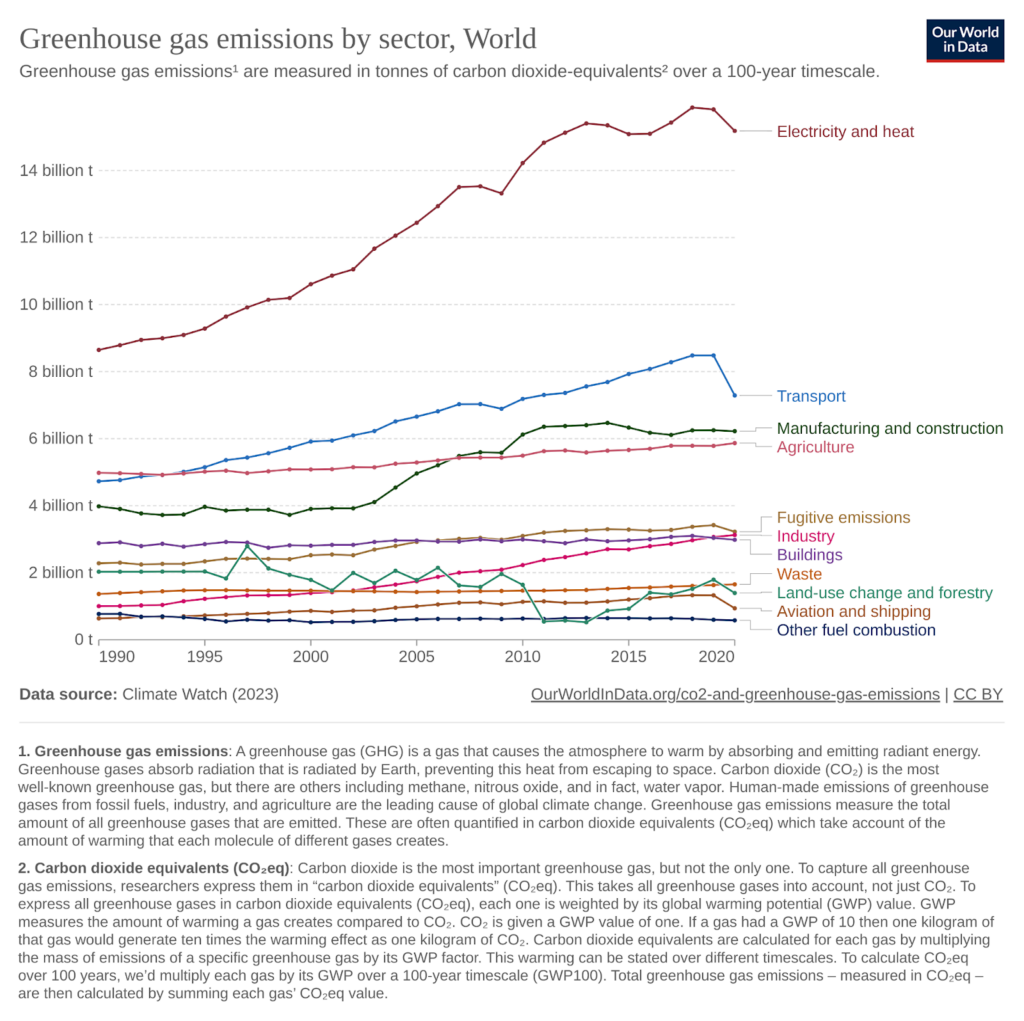
OurWorldInData.org/co2-and-greenhouse-gas-emissions | CC BY
So it is all about big power plants, mass transportation and mass production, right? We in the Information and Communication Technology (ICT) sector are the “good ones”. We help industries to digitize and reduce emissions in the future, right?
But wait, we need a large portion of electricity for compute and cooling too. In a study from 2020, researchers from Lancaster University found that ICT’s share of actual emissions could actually be as high as 2.1-3.9%3. Which is comparable to the global emissions from the aviation industry.
Consequently, ICT is part of the problem and needs to provide strategies to decarbonize and reduce emissions drastically. On the level of large data center providers like the large cloud providers or hosting companies this problem is recognized and also fueled by cost saving initiatives in the realm of rising energy costs. So reducing power consumption of processors and servers as well as reducing the cooling efforts is already a common practice.
But this is largely countered by the rising demand of new digital services and the ease and accessibility of compute infrastructure.
While we can monitor the overall consumption of a data center, each individual piece of service is not evaluated, maybe not even needed any more, but still consuming a portion of the energy in the cloud, the virtualized infrastructure, the memory registers and network transmissions. So there is a need to make energy consumption of ICT services visible at the beginning, where these services are produced.
Awareness is the first step towards a sustainable ICT industry.
Sustainability strategies
There are two major driving forces behind sustainability. The primary motivation is simply that we can’t go on as we did, since resources are limited and we have already eaten up more than we can. The second motivation is that we as a society have understood that we need rules for preserving our environment, be it for doing it as effectively as possible, or be it for those who are not aware of what they can do, or for those who do not assign sustainability the priority it effectively has, for whatever reason.
So you might make a difference between individual goals in terms of driving sustainability as much as you can, motivated by responsibility as an individual person or as a company aiming to differentiate in the market, or goals in terms of primarily meeting laws and regulations. In the first case, the question is often how much can I do, and how can I do it effectively for the best possible outcome. In the second case, the question is more how can I meet obligations with the least possible effort, or, in other words, how can I achieve compliance reliably and efficiently.
In both cases, as with any other goals, you need a plan on how to achieve your goals, you need a strategy. You may want to define intermediate goals like a yearly improvement in greenhouse gas (GHG) emission savings, as was decided with a global scale in the Paris Agreement from 2015, where 196 countries created a legally binding international treaty on climate change.
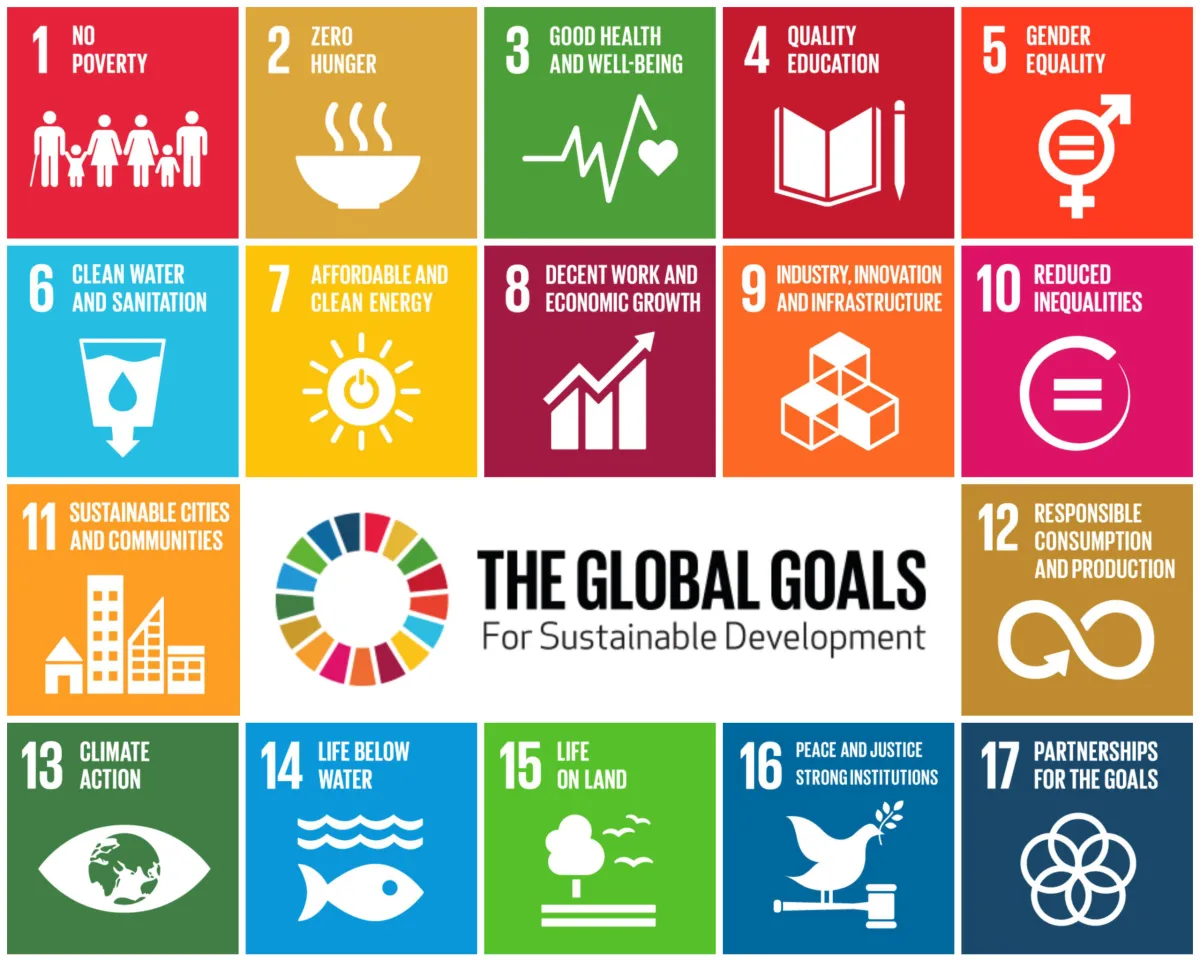
Generally speaking, sustainability goals are by far not limited to environmental topics. Sustainability is in general defined in four different areas: social, human, economic/business and environmental – the four pillars of sustainability. Already in September 2015, all 193 Member States of the United Nations adopted a plan for achieving a better future for all. At the heart of “Agenda 2030” are the 17 Sustainable Development Goals (SDGs) which clearly define the world we want — applying to all nations and leaving no one behind.

As a consequence of the agreements from 2015, many countries and the EU have developed their own strategy on how to meet those goals. Part of the strategies are laws and regulations, such as the EU Corporate Sustainability Reporting Directive (CSRD) from 2022, in order to increase the accountability of European companies on sustainability aspects and to introduce binding reporting standards at EU level.
As a matter of fact, implementing reporting obligations like CSRD is part of every company’s sustainability strategy. But there can be much more. Sustainability often means adapting a company’s culture and transforming the company’s business model towards sustainability. But it is also important to differentiate in the business through sustainability value creation.
Typical components of a sustainability strategy include
- transparent communication
- skill development
- data collection
- assessments in your decision and production processes
- interaction with your ecosystem
- identification of sustainability hotspots and quick wins
- effectively improving your position in the marketplace
Some measures of a sustainability strategy are concentrating on social and cultural aspects, some on the organization and some on methodology. But there are also technical aspects, especially in terms of how technology can support sustainability. Obviously this applies primarily to environments, which are of a highly technical nature, such as software development, telecommunications, data centers or cloud providers. Those environments may already deliver the data that we need in order to control our processes in a way that we can achieve the goals of our sustainability strategy. We also can optimize their impact on sustainability via automation and even by leveraging emerging technologies like AI/ML.
Breaking sustainability goals down in a strategy requires identifying the areas or the hotspots which are most responsible for violating sustainability principles, so they can be directly targeted for optimization strategies. In technical terms these are often procedures, applications and services, serving a certain part of the value chain. The question, however, is how can I get the data needed to concentrate my sustainability efforts.
One of the key aspects of technical sustainability is metrics. Technical systems create a massive amount of data, which can be used to determine the gap between current numbers and goals, and to tune the whole system in order to achieve or even over-achieve those goals. But you need to be able to gather reliable data, to process it in the right way, and finally to visualize the findings as part of your own reporting. The ability of collecting data might be considered as the foundation for a sustainability strategy.
In fact it works out that already collecting the right data in a reliable way is not a natural process. Just as an example, not every CPU or GPU has implemented the collection of real-time data on the power consumption of submodules such as cores or memory, which then might be transformed into GHG footprint calculations. And even if the CPU has implemented the appropriate functionality, there is in general no way to deliver the data to decision supporting applications.
For that reason, the open source community has triggered a number of projects dealing with sustainability issues. The probably currently most prominent community project is the Kepler project4, which has its focus on the collection, processing and visualization of metrics especially in cloud environments. Kepler uses the latest in technology such as eBPF to aggregate low level data in real time from your processing environment, and to deliver precise information on power consumption and – where this is not possible – does best effort estimations.
Building Blocks of a power measurement solution
In order to report power consumption data to application owners or developers, we would need several building blocks to provide this data:
Hardware layer
First of all, we need to be able to extract power usage data from the hardware itself. So we could extract the total power consumed on a physical device. Some information can be obtained via ACPI (Advanced Configuration and Power Interface), but on newer Intel machines there is a hardware feature called RAPL (Running Average Power Limit) that provides much more fine grained data.
When we run without direct access to the hardware, on a virtual machine or in a cloud environment we cannot easily extract this data. But we could learn from similar hardware configurations and runtime data that has trained an AI model to provide an estimation.
The KEPLER (Kubernetes Efficient Power Level Exporter) project (https://sustainable-computing.io/) follow these methods. But still: At this stage we only can collect the total amount of power a system consumes, not individual apps or services.
The Kernel Layer
To actually evaluate the distribution of power usage to the individual processes, VMs, containers, etc. we need to collect data from the running kernel controlling all these processes. But we keep in mind that we need to be as efficient as possible and prevent the data collection itself from consuming a large number of resources.
KEPLER uses probes via eBPF (extended Berkeley Packet Filter), a technique to dynamically run programs in the kernel context, to extract data from the running kernel tables. Here basically, how much CPU cycles a given process is consuming. With this data, the total power consumption can be distributed to the running processes.
Now that we have the data, we need to send it to a central data store.
Data Collection and Visualization
Creating new infrastructure to collect and visualize data is also counterproductive when we want to reduce our power consumption in total.
Ideally, we use what we already have: In modern Kubernetes installations like OpenShift there is typically a monitoring facility like prometheus available. KEPLER assumes this availability and connects to this existing infrastructure. Thus data can be stored, analyzed and visualized the same way as any other monitoring data on the cluster.
When there is no monitoring available one could also use a dedicated prometheus instance, but in general we should try to avoid setting up special infrastructure for the obvious reason.
How to Use the Data
Now that we have collected and presented the data, what are the next steps to actually reduce power consumption?
The first goal was to make the data visible to the developers and producers of new apps or services. With this visibility we are able to “shift left” the energy consumption responsibility from the operations team more to the development teams. This way, it is easier to directly act and do things differently to save on power.
Possible use cases are:
- Providing power tests during CI/CD runs to link changes in power consumption to actual code changes.
- Giving the developers a tool to experiment with different techniques to find the most efficient solution to a problem.
- Enable Developers to evaluate different frameworks like Quarkus, WASM or event-driven architectures to save on energy.
But one thing we need to keep in mind is that the most savings could be achieved by not running a service that is not essential. So creating a price tag to power consumption and make this visible to business owners, might have the biggest effect.
Outlook
In this article we described the motivation for creating sustainability strategies, and for utilizing technology in order to achieve sustainability goals. We also learned which data needs to be collected and what strategies could be applied to actually start saving energy.
The next article will concentrate more on the project Kepler, how to use it and and how to implement the foundation to collect the required data for your sustainability strategy and reporting, with special focus on how the monitoring of processes, pods and containers can support the optimization of applications and services with respect to sustainability goals.
- https://sustainability.stanford.edu/news/global-carbon-emissions-fossil-fuels-reached-record-high-2023 ↩︎
- https://www.mcc-berlin.net/en/research/co2-budget.html ↩︎
- https://arxiv.org/pdf/2102.02622.pdf ↩︎
- https://sustainable-computing.io, https://github.com/sustainable-computing-io/kepler, https://next.redhat.com/project/kepler/ ↩︎