
In this blog, I will guide you on:
- How do you enable application performance monitoring (APM)?
- How do you scale a user application based on application metrics with a Horizontal Pod Autoscaler (HPA)?
- How do you create an alert based on application metrics and send this alert to an external system?
For the monitoring, I will use the OpenShift Monitoring with a new feature for monitoring your own services, User Workload Monitoring.
You can use OpenShift Monitoring for your own services in addition to monitoring the cluster. This way, you do not need to use an additional monitoring solution. This helps keep monitoring centralized. Additionally, you can extend the access to the metrics of your services beyond cluster administrators. This enables developers and arbitrary users to access these metrics.
News:
- The developer can scale the application by using the Custom Metrics Autoscaler Operator, based on Kubernetes-based Event Driven Autoscaler (KEDA). It was released with OpenShift 4.12.
- The developer can create alerts and forward these alerts to an external system.
See Configuring user workload monitoring
NB: This article is the revised version of my earlier post from 2022, but some of the features mentioned in there are no longer available.
Enabling Monitoring of Your Own Services in OpenShift
This is done by an update on the configmap within the project openshift-monitoring.
Make sure you are logged in as cluster-admin:
$ cat <<EOF | oc apply -f -
apiVersion: v1
kind: ConfigMap
metadata:
  name: cluster-monitoring-config
  namespace: openshift-monitoring
data:
  config.yaml: |
    enableUserWorkload: true
    alertmanagerMain:
      enableUserAlertmanagerConfig: true
EOF
As a cluster administrator, you can enable alert routing for user-defined projects. With this feature, you can allow users with the alert-routing-edit cluster role to configure alert notification routing and receivers for user-defined projects. These notifications are routed by the optional Alertmanager instance dedicated to user-defined monitoring.
Check User Workload Monitoring
After a short time, you can check that all the user-workload-monitoring pods are up and running:
$ oc get pod -n openshift-user-workload-monitoring
NAME                                   READY   STATUS    RESTARTS   AGE
alertmanager-user-workload-0           6/6     Running   0          60s
alertmanager-user-workload-1           6/6     Running   0          59s
prometheus-operator-744ff78877-wrt5f   2/2     Running   0          66s
prometheus-user-workload-0             6/6     Running   0          43s
prometheus-user-workload-1             6/6     Running   0          43s
thanos-ruler-user-workload-0           4/4     Running   0          60s
thanos-ruler-user-workload-1           4/4     Running   0          60s
Install the Custom Metrics Autoscaler Operator
- In the OpenShift Container Platform web console, click Operators → OperatorHub.
- Choose Custom Metrics Autoscaler from the list of available Operators, and click Install.
- On the Install Operator page, ensure that the All namespaces on the cluster (default) option is selected for Installation Mode. This installs the Operator in all namespaces.
- Ensure that the openshift-keda namespace is selected as Installed Namespace. OpenShift Container Platform creates the namespace, if not present in your cluster.
- Click Install.
- Verify the installation
$ oc get all -n openshift-keda
Warning: apps.openshift.io/v1 DeploymentConfig is deprecated in v4.14+, unavailable in v4.10000+
Warning: kubevirt.io/v1 VirtualMachineInstancePresets is now deprecated and will be removed in v2.
NAME                                                     READY   STATUS    RESTARTS   AGE
pod/custom-metrics-autoscaler-operator-54db496b7-cww25   1/1     Running   0          42s
NAME                                                 READY   UP-TO-DATE   AVAILABLE   AGE
deployment.apps/custom-metrics-autoscaler-operator   1/1     1            1           43s
NAME                                                           DESIRED   CURRENT   READY   AGE
replicaset.apps/custom-metrics-autoscaler-operator-54db496b7   1         1         1       43s
See Installing the custom metrics autoscaler
Install the KedaController custom resource, which creates the required CRD
$ cat <<EOF | oc apply -f -
apiVersion: keda.sh/v1alpha1
kind: KedaController
metadata:
  name: keda
  namespace: openshift-keda
spec:
  admissionWebhooks:
    logEncoder: console
    logLevel: info
  metricsServer:
    logLevel: "0"
  operator:
    logEncoder: console
    logLevel: info
  watchNamespace: ""
EOF
kedacontroller.keda.sh/keda created
watchNamespaces specifies a single namespace in which the Custom Metrics Autoscaler Operator should scale applications. Leave it blank or leave it empty to scale applications in all namespaces.
Verify the keda pods are up and running
$ c get pod -n openshift-keda
NAME                                                  READY   STATUS    RESTARTS   AGE
custom-metrics-autoscaler-operator-66ccfc9f6c-89vhs   1/1     Running   0          3m58s
keda-admission-569c474866-l5q2s                       1/1     Running   0          34s
keda-metrics-apiserver-77556ffd5b-kkkm7               1/1     Running   0          37s
keda-operator-7fbb8bc74f-fd228                        1/1     Running   0          41s
Understanding Custom Metrics Autoscaler triggers
Triggers, also known as scalers, provide the metrics that the Custom Metrics Autoscaler Operator uses to scale your pods.
The Custom Metrics Autoscaler currently supports the Prometheus, CPU, memory, Apache Kafka, and cron triggers.
You use a ScaledObject or ScaledJob custom resource to configure triggers for specific objects.
- Prometheus trigger: You can scale pods based on Prometheus metrics, which can use the installed OpenShift Container Platform monitoring or an external Prometheus server as the metrics source.
- CPU trigger: You can scale pods based on CPU metrics. This trigger uses cluster metrics as the source for metrics.
- Memory trigger:You can scale pods based on memory metrics. This trigger uses cluster metrics as the source for metrics.
See Understanding custom metrics autoscaler triggers
Create a New Project
Create a new project (for example monitor-demo) and give a normal user (such as developer) admin rights onto the project. Add the newly created role (monitoring-edit) to the user:
$ oc new-project monitor-demo
You can add applications to this project with the 'new-app' command. For example, try:

    oc new-app django-psql-example

to build a new example application in Python. Or use kubectl to deploy a simple Kubernetes application:

    kubectl create deployment hello-node --image=k8s.gcr.io/serve_hostname

$ oc policy add-role-to-user admin developer -n monitor-demo
clusterrole.rbac.authorization.k8s.io/admin added: "developer"
$ oc policy add-role-to-user monitoring-edit developer -n monitor-demo
clusterrole.rbac.authorization.k8s.io/monitoring-edit added: "developer"
$ oc policy add-role-to-user alert-routing-edit developer -n monitor-demo
clusterrole.rbac.authorization.k8s.io/alert-routing-edit added: "developer"
The role alert-routing-edit is only required if the user should be able to configure alert notification routing and receivers for user-defined projects.
Login as the Normal User
$ oc login -u developer
Authentication required for https://api.rbaumgar.demo.net:6443 (openshift)
Username: developer
Password:
Login successful.

You have one project on this server: "monitor-demo"

Using project "monitor-demo".
Sample Application
Deploy a Sample Application
All modern application development frameworks (like Quarkus) support out-of-the-box metrics features, like Eclipse Microprofile support in Quarkus, Quarkus – MicroProfile Metrics.
To simplify this document, I am using an existing example. The application is based on an example at GitHub – rbaumgar/monitor-demo-app: Quarkus demo app to show Application Performance Monitoring (APM).
Deploying a sample application monitor-demo-app and exposes a route:
$ cat <<EOF | oc apply -f -
apiVersion: apps/v1
kind: Deployment
metadata:
  labels:
    app: monitor-demo-app
  name: monitor-demo-app
spec:
  replicas: 1
  selector:
    matchLabels:
      app: monitor-demo-app
  template:
    metadata:
      labels:
        app: monitor-demo-app
    spec:
      containers:
      - image: quay.io/rbaumgar/monitor-demo-app-jvm
        imagePullPolicy: IfNotPresent
        name: monitor-demo-app
---
apiVersion: v1
kind: Service
metadata:
  labels:
    app: monitor-demo-app
  name: monitor-demo-app
spec:
  ports:
  - port: 8080
    protocol: TCP
    targetPort: 8080
    name: web
  selector:
    app: monitor-demo-app
  type: ClusterIP
---
apiVersion: route.openshift.io/v1
kind: Route
metadata:
  labels:
    app: monitor-demo-app
  name: monitor-demo-app
spec:
  path: /
  to:
    kind: Service
    name: monitor-demo-app
  port:
    targetPort: web
EOF
deployment.apps/monitor-demo-app created
service/monitor-demo-app created
route.route.openshift.io/monitor-demo-app exposed
If you want to use the Quarkus native image, change the image name in the deployment to monitor-demo-app-native.
It is very important that you define labels at the Deployment and Service. Those will be referenced later!
Test Sample Application
Check the router URL with /hello and see the hello message with the pod name. Do this multiple times.
$ export URL=$(oc get route monitor-demo-app -o jsonpath='{.spec.host}')
$ curl $URL/hello
hello from monitor-demo-app monitor-demo-app-78fc685c94-mtm28
$ curl $URL/hello
hello from monitor-demo-app monitor-demo-app-78fc685c94-mtm28
...
Check Available Metrics
See all available metrics /q/metrics and only application specific metrics /q/metrics/application:
$ curl $URL/q/metrics/application
# HELP application_greetings_total How many greetings we've given.
# TYPE application_greetings_total counter
application_greetings_total 3.0
# HELP application_greetings_2xx_total How many 2xx we've given.
# TYPE application_greetings_2xx_total counter
application_greetings_2xx_total 0.0
# HELP application_greetings_5xx_total How many 5xx we've given.
# TYPE application_greetings_5xx_total counter
application_greetings_5xx_total 0.0
# TYPE application_org_example_rbaumgar_PrimeNumberChecker_checksTimer_rate_per_second gauge
application_org_example_rbaumgar_PrimeNumberChecker_checksTimer_rate_per_second 0.0
# TYPE application_org_example_rbaumgar_PrimeNumberChecker_checksTimer_one_min_rate_per_second gauge
...
With application_greetings_total, you will see how often you have called the /hello URL. Later, we will use this metric.
Setting up Metrics Collection
To use the metrics exposed by your service, you need to configure OpenShift Monitoring to scrape metrics from the /q/metrics endpoint. You can do this using a ServiceMonitor, a custom resource definition (CRD) that specifies how a service should be monitored, or a PodMonitor, a CRD that specifies how a pod should be monitored. The former requires a Service object, while the latter does not, allowing Prometheus to directly scrape metrics from the metrics endpoint exposed by a pod.
$ cat <<EOF | oc apply -f -
apiVersion: monitoring.coreos.com/v1
kind: ServiceMonitor
metadata:
  labels:
    k8s-app: monitor-demo-monitor
  name: monitor-demo-monitor
spec:
  endpoints:
  - interval: 30s
    port: web
    scheme: http
    path: /q/metrics
  selector:
    matchLabels:
      app: monitor-demo-app
EOF
servicemonitor.monitoring.coreos.com/monitor-demo-monitor created
$ oc get servicemonitor
NAME                   AGE
monitor-demo-monitor   42s
For a Quarkus application, the default path for metrics is /q/metrics, so you have to specify it!
If you are not able to create the ServiceMonitor, you do not have the role montitoring-rules-edit.
The matchLabels must be the same as you defined at the Deployment and Service!
Accessing the Metrics of Your Service
Once you have enabled the monitoring of your own services, deployed a service, and set up metrics collection for it, you can access the metrics of the service as a cluster administrator, as a developer, or as a user with view permissions for the project.
- Access the Prometheus web interface:
- To access the metrics as a cluster administrator, go to the OpenShift Container Platform web console, switch to the Administrator Perspective, and click Observer → Metrics (OpenShift 4.8+).
Cluster administrators, when using the Administrator Perspective, have access to all cluster metrics and to custom service metrics from all projects.
Only cluster administrators have access to the Alertmanager and Prometheus UIs.
- To access the metrics as a developer or a user with permissions, go to the OpenShift Container Platform web console, switch to the Developer Perspective, then click Observer → Metrics.
Developers can only use the Developer Perspective. They can only query metrics from a single project.
- Use the PromQL interface to run queries for your services.
Here is an example:
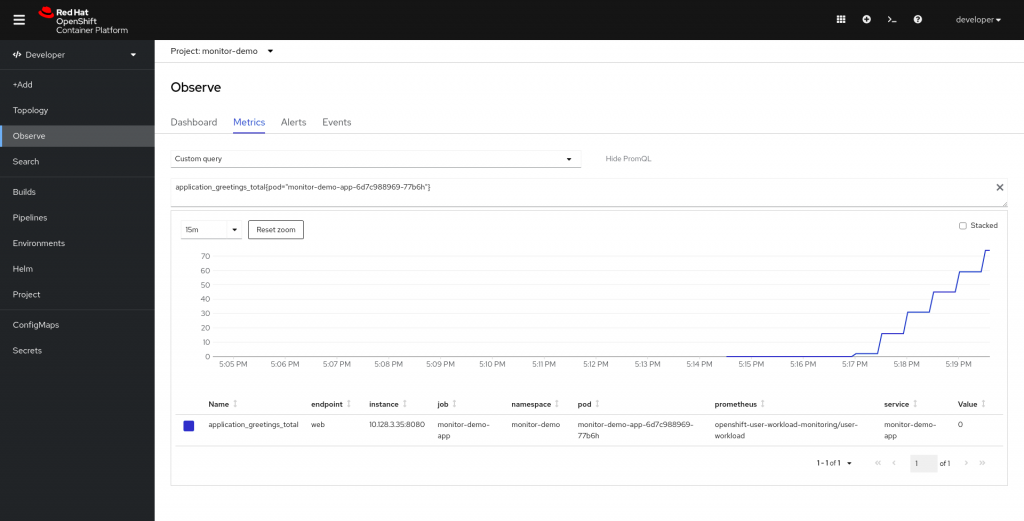
You can generate load onto your application, and so you will see more on the graph.
$ for i in {1..1000}; do curl $URL/hello; sleep 10; donePromQL Example: If you want to see the number of requests per second (rated in two minutes) on the sample service, you can use the following query:
sum(rate(application_greetings_total{namespace=”monitor-demo”}[2m]))
You can also use the Thanos Querier to display the application metrics. The Thanos Querier enables aggregating and, optionally, deduplicating cluster and user workload metrics under a single, multi-tenant interface.
Thanos Querier can be reached at: https://thanos-querier-openshift-monitoring.apps.your.cluster/graph
That you don’t have a network policy in place which prevents the user workload monitoring to get metrics data.
If you are just interested in exposing application metrics to the dashboard, you can stop here.
Exposing Custom Application Metrics for Auto-Scaling
You can export application metrics for the Horizontal Pod Autoscaler (HPA).
Create a Service Account and a Secret to generate a Service Account Token
Create a new service account to get access to the Thanos data. Thanos holds the collected metrics.
$ cat <<EOF | oc apply -f -
apiVersion: v1
kind: ServiceAccount
metadata:
  name: thanos
---
apiVersion: v1
kind: Secret
metadata:
  name: thanos-token
  annotations:
    kubernetes.io/service-account.name: thanos
type: kubernetes.io/service-account-token
EOF
serviceaccount/thanos created
secret/thanos-token created
Locate the token assigned to the service account:
$ oc describe secret/thanos-token
Name:         thanos-token
Namespace:    monitor-demo
Labels:       <none>
Annotations:  kubernetes.io/service-account.name: thanos
              kubernetes.io/service-account.uid: 0a45d802-1631-4a7e-bd5a-40f2e8328529

Type:  kubernetes.io/service-account-token

Data
====
ca.crt:          8594 bytes
namespace:       12 bytes
service-ca.crt:  11019 bytes
token:           eyJhbGciOiJSUzI1NiIsImt...

$ oc describe serviceaccount thanos
Name:                thanos
Namespace:           monitor-demo
Labels:              <none>
Annotations:         openshift.io/internal-registry-pull-secret-ref: thanos-dockercfg-cxl6z
Image pull secrets:  thanos-dockercfg-cxl6z
Mountable secrets:   thanos-dockercfg-cxl6z
Tokens:              thanos-token
Events:              <none>
You can see that the Secret now contains an API token for the ServiceAccount thanos.
Create a Trigger Authenticator
$ cat <<EOF | oc apply -f -
apiVersion: keda.sh/v1alpha1
kind: TriggerAuthentication
metadata:
  name: keda-trigger-auth-prometheus
spec:
  secretTargetRef:
  - parameter: bearerToken
    name: thanos-token
    key: token
  - parameter: ca
    name: thanos-token
    key: ca.crt
EOF
triggerauthentication.keda.sh/keda-trigger-auth-prometheus created
Create the Required Cluster Roles
$ cat <<EOF | oc apply -f -
apiVersion: rbac.authorization.k8s.io/v1
kind: Role
metadata:
  name: thanos-metrics-reader
rules:
- apiGroups:
  - ""
  resources:
  - pods
  verbs:
  - get
- apiGroups:
  - metrics.k8s.io
  resources:
  - pods
  - nodes
  verbs:
  - get
  - list
  - watch
EOF
role.rbac.authorization.k8s.io/thanos-metrics-reader created
Add the newly created role bindings for the service account:
$ cat <<EOF | oc apply -f -
apiVersion: rbac.authorization.k8s.io/v1
kind: RoleBinding
metadata:
  name: thanos-metrics-reader
roleRef:
  apiGroup: rbac.authorization.k8s.io
  kind: Role
  name: thanos-metrics-reader
subjects:
- kind: ServiceAccount
  name: thanos
  namespace: monitor-demo
EOF
rolebinding.rbac.authorization.k8s.io/thanos-metrics-reader created
Create the Prometheus Trigger
The trigger accesses the data with the triggerAuthenticator from Thanos.
$ cat <<EOF | oc apply -f -
apiVersion: keda.sh/v1alpha1
kind: ScaledObject
metadata:
  name: monitor-so
spec:
  maxReplicaCount: 5
  minReplicaCount: 1
  scaleTargetRef:
    name: monitor-demo-app
    kind: Deployment
  triggers:
  - type: prometheus
    authenticationRef:
      name: keda-trigger-auth-prometheus
    metadata:
      authModes: bearer
      ignoreNullValues: "true"
      metricName: my_http_requests
      namespace: monitor-demo
      query: sum(rate(application_greetings_total{job="monitor-demo-app"}[1m]))
      serverAddress: https://thanos-querier.openshift-monitoring.svc.cluster.local:9092
      threshold: "1"
      unsafeSsl: "false"
    type: prometheus
EOF
scaledobject.keda.sh/monitor-so created
If you are using a different namespace, please don’t forget to replace the namespace (monitor-demo). And when you want to scale a different deployment object, you have to change the name in the scaleTargetRef.
Check the ScaledObject (so) and the automatically-created Horizontal Pod Autoscaling (hpa):
$ oc get so
NAME         SCALETARGETKIND      SCALETARGETNAME    MIN   MAX   TRIGGERS     AUTHENTICATION                 READY   ACTIVE   FALLBACK   PAUSED    AGE
monitor-so   apps/v1.Deployment   monitor-demo-app   1           prometheus   keda-trigger-auth-prometheus   True    False    Unknown    Unknown   25s
$ oc get hpa
NAME                  REFERENCE                     TARGETS     MINPODS   MAXPODS   REPLICAS   AGE
keda-hpa-monitor-so   Deployment/monitor-demo-app   0/1 (avg)   1         100       1          59s
The name for the hpa gets a prefix of keda-hpa-.
Now it is time to do the final test!
Run the load generator on one screen. Something like:
$ for i in {1..1000}; do curl $URL/hello >/dev/null 2>&1; sleep .10; doneOn another screen, we will check the number of pods:
$ for i in {1..20}; do oc get pod -l app=monitor-demo-app; sleep 30; done
NAME                                READY   STATUS    RESTARTS   AGE
monitor-demo-app-67f655bf68-98qv7   1/1     Running   0          8m14s
NAME                                READY   STATUS    RESTARTS   AGE
monitor-demo-app-67f655bf68-98qv7   1/1     Running   0          8m44s
NAME                                READY   STATUS    RESTARTS   AGE
monitor-demo-app-67f655bf68-4jpw4   1/1     Running   0          27s
monitor-demo-app-67f655bf68-98qv7   1/1     Running   0          9m15s
monitor-demo-app-67f655bf68-jmkq4   1/1     Running   0          27s
NAME                                READY   STATUS    RESTARTS   AGE
monitor-demo-app-67f655bf68-4jpw4   1/1     Running   0          57s
monitor-demo-app-67f655bf68-98qv7   1/1     Running   0          9m45s
monitor-demo-app-67f655bf68-g2fk2   1/1     Running   0          26s
monitor-demo-app-67f655bf68-jmkq4   1/1     Running   0          57s
monitor-demo-app-67f655bf68-rpb6m   1/1     Running   0          26s
...
NAME                                READY   STATUS    RESTARTS   AGE
monitor-demo-app-67f655bf68-4jpw4   1/1     Running   0          7m1s
monitor-demo-app-67f655bf68-98qv7   1/1     Running   0          15m
monitor-demo-app-67f655bf68-jmkq4   1/1     Running   0          7m1s
NAME                                READY   STATUS    RESTARTS   AGE
monitor-demo-app-67f655bf68-98qv7   1/1     Running   0          16m
We see that the number of pods is increasing automatically.
We can also check the HPA.
Under TARGETS we see the actual value of my_http_requests:
$ for i in {1..20}; do oc get hpa; sleep 30; done
NAME                  REFERENCE                     TARGETS     MINPODS   MAXPODS   REPLICAS   AGE
keda-hpa-monitor-so   Deployment/monitor-demo-app   0/1 (avg)   1         5         1          10m
NAME                  REFERENCE                     TARGETS         MINPODS   MAXPODS   REPLICAS   AGE
keda-hpa-monitor-so   Deployment/monitor-demo-app   2772m/1 (avg)   1         5         1          10m
NAME                  REFERENCE                     TARGETS         MINPODS   MAXPODS   REPLICAS   AGE
keda-hpa-monitor-so   Deployment/monitor-demo-app   1457m/1 (avg)   1         5         3          11m
NAME                  REFERENCE                     TARGETS        MINPODS   MAXPODS   REPLICAS   AGE
keda-hpa-monitor-so   Deployment/monitor-demo-app   934m/1 (avg)   1         5         5          11m
...
keda-hpa-monitor-so   Deployment/monitor-demo-app   0/1 (avg)   1         5         3          17m
NAME                  REFERENCE                     TARGETS     MINPODS   MAXPODS   REPLICAS   AGE
keda-hpa-monitor-so   Deployment/monitor-demo-app   0/1 (avg)   1         5         1          18mN
Perfect! Everything works as expected!
Congratulations!
Oh, one more thing …
Scale Down
If scaling down takes longer than expected, the cooldownPeriod in the ScaledObject specifies the period in seconds to wait after the last trigger is reported before scaling the deployment back to 0 if the minReplicaCount is set to 0. The default is 300.
Alert Rules
Create Alert Rule
$ cat <<EOF | oc apply -f -
apiVersion: monitoring.coreos.com/v1
kind: PrometheusRule
metadata:
  name: example-500-alert
  labels:
    openshift.io/prometheus-rule-evaluation-scope: leaf-prometheus
spec:
  groups:
    - name: example
      rules:
        - alert: Error500Alert
          description: The demo application has received more than two "/hello/5xx" within one minute
          message: 5xx received
          summary: more 2 5xx requests where received within 1 minute
          expr: increase(application_greetings_5xx_total{job="monitor-demo-app"}[1m]) > 2
EOF
prometheusrules.monitoring.coreos.com/example-500-alert created
This configuration creates an alerting rule named example-500-alert. The alerting rule fires an alert when the counter of 5xx requests increases by more the 2 in one minute.
If that label (leaf-prometheus) is present, the alerting rule is deployed on the Prometheus instance in the openshift-user-workload-monitoring project. If the label is not present, the alerting rule is deployed to Thanos Ruler.
The cluster-admin can view all alert rules in the Administrator perspective, navigate to Monitoring → Alerting → Alerting Rules.
The user can view the rules of one project in the Developer perspective, navigate to Observe → Alerts in the OpenShift Container Platform web console.
Sending Alerts to External Systems
In OpenShift Container Platform, firing alerts can be viewed in the Alerting UI. Alerts are not configured by default to be sent to any notification systems. You can configure OpenShift Container Platform to send alerts to the following receiver types:
- PagerDuty
- Webhook
- Slack
In this demo, we will send the alert to our sample application (webhook).
Configuring alert receivers
You can configure the alert receivers as a developer.
$ cat <<EOF | oc apply -f -
apiVersion: monitoring.coreos.com/v1beta1
kind: AlertmanagerConfig
metadata:
  name: example-routing
spec:
  route:
    groupBy: ['alertname']
    groupWait: 30s
    groupInterval: 1m
    repeatInterval: 2m
    receiver: monitor-app
  receivers:
  - name: monitor-app
    webhookConfigs:
    - url: http://${URL}/hello/alert-hook
EOF
alertmanagerconfig.monitoring.coreos.com/example-routing created
More Details Managing alerts as a Developer
Test Alert
Call the 5xx URL of the demo application twice and check the log of the demo application.
$ export URL=$(oc get route monitor-demo-app -o jsonpath='{.spec.host}')
$ curl $URL/hello/5xx
Got 5xx Response
$ curl $URL/hello/5xx
Got 5xx Response
$ oc logs deployment/monitor-demo-app -f
...
2025-04-25 11:00:16,187 INFO  [org.exa.rba.GreetingResource] (executor-thread-3) 5xx received
2025-04-25 11:00:16,956 INFO  [org.exa.rba.GreetingResource] (executor-thread-3) 5xx received
2025-04-25 11:00:17,777 INFO  [org.exa.rba.GreetingResource] (executor-thread-3) 5xx received
2025-04-25 11:00:18,633 INFO  [org.exa.rba.GreetingResource] (executor-thread-3) 5xx received
2025-04-25 11:00:19,886 INFO  [org.exa.rba.GreetingResource] (executor-thread-3) 5xx received
2025-04-25 11:00:35,600 INFO  [org.exa.rba.GreetingResource] (executor-thread-3) Alert received:
{
  "receiver": "monitor-demo/example-routing/monitor-app",
  "status": "firing",
  "alerts": [
    {
      "status": "firing",
      "labels": {
        "alertname": "Error500Alert",
        "endpoint": "web",
        "instance": "10.130.0.80:8080",
        "job": "monitor-demo-app",
        "namespace": "monitor-demo",
        "pod": "monitor-demo-app-67f655bf68-r7trc",
        "prometheus": "openshift-user-workload-monitoring/user-workload",
        "service": "monitor-demo-app"
      },
      "annotations": {},
      "startsAt": "2025-04-25T11:00:35.042Z",
      "endsAt": "0001-01-01T00:00:00Z",
      "generatorURL": "https://console-openshift-console.apps.ocp4.openshift.freeddns.org/monitoring/graph?g0.expr=increase%28application_greetings_5xx_total%7Bjob%3D%22monitor-demo-app%22%2Cnamespace%3D%22monitor-demo%22%7D%5B1m%5D%29+%3E+2&g0.tab=1",
      "fingerprint": "483eb0cd5dcb2110"
    }
  ],
  "groupLabels": {
    "alertname": "Error500Alert"
  },
  "commonLabels": {
    "alertname": "Error500Alert",
    "endpoint": "web",
    "instance": "10.130.0.80:8080",
    "job": "monitor-demo-app",
    "namespace": "monitor-demo",
    "pod": "monitor-demo-app-67f655bf68-r7trc",
    "prometheus": "openshift-user-workload-monitoring/user-workload",
    "service": "monitor-demo-app"
  },
  "commonAnnotations": {},
  "externalURL": "https://console-openshift-console.apps.ocp4.openshift.freeddns.org/monitoring",
  "version": "4",
  "groupKey": "{}/{namespace="monitor-demo"}:{alertname="Error500Alert"}",
  "truncatedAlerts": 0
}

2025-04-25 11:01:35,071 INFO  [org.exa.rba.GreetingResource] (executor-thread-3) Alert received:
{
  "receiver": "monitor-demo/example-routing/monitor-app",
  "status": "resolved",
  "alerts": [
    {
      "status": "resolved",
      "labels": {
        "alertname": "Error500Alert",
        "endpoint": "web",
        "instance": "10.130.0.80:8080",
        "job": "monitor-demo-app",
        "namespace": "monitor-demo",
        "pod": "monitor-demo-app-67f655bf68-r7trc",
        "prometheus": "openshift-user-workload-monitoring/user-workload",
        "service": "monitor-demo-app"
      },
      "annotations": {},
      "startsAt": "2025-04-25T11:00:35.042Z",
      "endsAt": "2025-04-25T11:01:05.042Z",
      "generatorURL": "https://console-openshift-console.apps.ocp4.openshift.freeddns.org/monitoring/graph?g0.expr=increase%28application_greetings_5xx_total%7Bjob%3D%22monitor-demo-app%22%2Cnamespace%3D%22monitor-demo%22%7D%5B1m%5D%29+%3E+2&g0.tab=1",
      "fingerprint": "483eb0cd5dcb2110"
    }
  ],
  "groupLabels": {
    "alertname": "Error500Alert"
  },
  "commonLabels": {
    "alertname": "Error500Alert",
    "endpoint": "web",
    "instance": "10.130.0.80:8080",
    "job": "monitor-demo-app",
    "namespace": "monitor-demo",
    "pod": "monitor-demo-app-67f655bf68-r7trc",
    "prometheus": "openshift-user-workload-monitoring/user-workload",
    "service": "monitor-demo-app"
  },
  "commonAnnotations": {},
  "externalURL": "https://console-openshift-console.apps.ocp4.openshift.freeddns.org/monitoring",
  "version": "4",
  "groupKey": "{}/{namespace="monitor-demo"}:{alertname="Error500Alert"}",
  "truncatedAlerts": 0
}
You will find in the application log two alerts received. One when the alert is fired (status:firing) and one minute later when the alert is resolved (status:resolved).
Congratulations! Done!
Remove this Demo
$ oc delete alertmanagerconfig.monitoring.coreos.com/example-routing
$ oc delete prometheusrules.monitoring.coreos.com/example-500-alert
$ oc delete scaledobject.keda.sh/monitor-so
$ oc delete deployment.apps/monitor-demo-app
$ oc delete service/monitor-demo-app
$ oc delete route.route.openshift.io/monitor-demo-app
$ oc delete project monitor-demo
# as cluster-admin
$ oc edit configmap/cluster-monitoring-config -n openshift-monitoring
$ oc get pod -n openshift-user-workload-monitoring
The OpenShift Custom Metrics Autoscaler Operator can be removed as cluster-admin from within the OpenShift console.
Source for this document:
Github: rbaumgar/monitor-demo-app